Managing modern applications and infrastructure has become increasingly challenging. Today’s systems are highly distributed, deployments occur at a rapid pace, and potential issues can arise at any moment. This is where monitoring tools play a critical role. They provide visibility, detect glitches early, and enable teams to respond before end users experience disruptions.
In 2025, DevOps teams have access to more sophisticated monitoring solutions than ever before. These platforms go beyond basic system checks, offering:
- Real-time dashboards for instant visibility into system health and performance metrics.
- AI-driven analytics to predict failures, identify patterns, and optimize resource usage.
- Automated alerts and integrations to streamline incident response and reduce downtime.
This guide highlights 21 of the most effective DevOps monitoring tools available today. Whether you’re managing Kubernetes clusters, scaling multi-cloud environments, or monitoring legacy infrastructure, these solutions can help maintain stability, improve performance, and keep operations ahead of potential issues.
What is DevOps Monitoring?
DevOps monitoring is an ongoing process of observing the health, performance, and stability of applications, infrastructure, and services across the entire software delivery lifecycle. Its goal is to help teams identify potential issues early, assess the impact of changes, and ensure a consistent, high-quality user experience.
Unlike traditional monitoring, which is often limited to post-deployment checks, DevOps monitoring spans every stage of delivery from development, testing, staging, and production. This continuous visibility allows teams to understand how systems behave in real time and respond proactively to emerging risks.
Key benefits of DevOps monitoring include:
- Early issue detection: Identifies and addresses problems before they affect end users.
- Performance optimization: Tracks system metrics and trends to improve speed, stability, and resource efficiency.
- Enhanced collaboration: Provides shared insights that align development and operations teams around performance goals.
DevOps monitoring is more than a troubleshooting tool, it’s a continuous feedback mechanism that supports faster releases, higher reliability, and more resilient operations.
Types of Monitoring in DevOps
Monitoring in DevOps isn’t a one-size-fits-all approach. Different systems and workflows demand different kinds of visibility. Understanding the main types of monitoring helps teams choose the right tools and strategies for their setup.
1. Infrastructure Monitoring: Infrastructure monitoring keeps an eye on servers, virtual machines, storage, and network resources. It helps detect hardware failures, resource bottlenecks, and capacity issues before they impact applications. Tools like Zabbix, Nagios, and SolarWinds excel in this space.
2. Application Performance Monitoring (APM): APM focuses on how applications behave in real-time. It tracks response times, error rates, database queries, and user interactions. Solutions like New Relic, AppDynamics, and Dynatrace provide deep insights into application health and performance.
3. Log Monitoring: Logs are a goldmine for troubleshooting. Log monitoring tools collect, index, and analyze log files from applications, servers, and services. Platforms like ELK Stack (Elasticsearch, Logstash, Kibana) and Splunk help teams quickly detect anomalies and trace root causes.
4. Network Monitoring: Network monitoring tracks connectivity, bandwidth, latency, and traffic flow. It ensures smooth communication between systems and flags potential security threats. Tools such as Nagios, Icinga, and PRTG are widely used for this purpose.
5. Security Monitoring: Security monitoring focuses on threat detection, vulnerability management, and compliance checks. It integrates with SIEM solutions to spot suspicious activity and potential breaches. Splunk and Sysdig often play a dual role in performance and security monitoring.
6. Cloud and Container Monitoring: Cloud-native and containerized environments require specialized monitoring to handle their dynamic nature. Platforms like Datadog, Kubecost, and Sysdig monitor container performance, resource allocation, and cost optimization.
7. End-User Experience Monitoring: Also called Real User Monitoring (RUM), this type measures the performance and availability of applications from the end-user’s perspective. Tools like BrowserStack Test Observability and New Relic help teams ensure smooth user experiences across devices and geographies.
Most Popular Monitoring Tools in DevOps for 2025
Before going into deep, here’s a quick comparison of the top DevOps monitoring tools, their strengths, and best-fit use cases to help you choose the right one for your workflow.
| Tool | Category | Best For | Key Features | Open-source / Premium |
| Prometheus | Infrastructure & Environment Monitoring | Cloud-native, Kubernetes | Time-series data, PromQL, flexible alerting | Open-source |
| Zabbix | Infrastructure & Environment Monitoring | Scalable environments | Auto-discovery, real-time metrics | Open-source |
| Nagios | Infrastructure & Environment Monitoring | Servers, networks, apps | Robust alerting, plugin architecture | Open-source (Core) / Premium (XI) |
| Icinga | Infrastructure & Environment Monitoring | Flexible, plugin-based environments | Modular architecture, scalable alerting | Open-source |
| SolarWinds | Infrastructure & Environment Monitoring | Hybrid & on-prem environments | Performance troubleshooting, customizable alerts | Premium |
| Netdata | Infrastructure & Environment Monitoring | Low-latency environments | Second-by-second insights, auto-detection | Open-source |
| AppDynamics | Application & Service Performance Monitoring (APM) | Business-impact-focused monitoring | Code-level diagnostics, anomaly detection | Premium |
| New Relic | Application & Service Performance Monitoring (APM) | Full-stack observability | Distributed tracing, error tracking, dashboards | Premium (Free tier available) |
| Dynatrace | Application & Service Performance Monitoring (APM) | Large-scale, dynamic environments | Davis AI, automated root cause analysis | Premium |
| Datadog | Observability & Data Analysis | Cloud, containers, microservices | Logs, metrics, APM, 600+ integrations | Premium |
| Grafana | Observability & Data Analysis | Multi-source metrics visualization | Custom dashboards, plugins, alerting | Open-source (Core) / Premium (Cloud, Enterprise) |
| Elastic Stack (ELK) | Observability & Data Analysis | Centralized log analysis | Elasticsearch search, Logstash processing, Kibana visualization | Open-source |
| Splunk | Observability & Data Analysis | Large-scale log analytics | Machine data indexing, anomaly detection | Premium (Free tier available) |
| Sematext | Observability & Data Analysis | Unified metrics, logs, events | Real-time monitoring, anomaly detection | Premium (Free tier available) |
| Honeycomb | Observability & Data Analysis | Debugging microservices | Event-based data, high-speed queries | Premium |
| Epsagon | Observability & Data Analysis | Distributed tracing | Auto-instrumentation, real-time service maps | Premium |
| Sysdig | Cloud, Container & Kubernetes Monitoring | Kubernetes & containerized workloads | Runtime security, service maps | Open-source (Core) / Premium |
| Kubecost | Cloud, Container & Kubernetes Monitoring | Cost optimization for Kubernetes | Budget alerts, cost allocation | Open-source (Core) / Premium |
| Sensu | CI/CD Pipeline & Toolchain Monitoring | Scalable health checks | Event processing, observability pipeline | Open-source (Core) / Premium |
| BrowserStack Test Observability | Test Automation & Quality Monitoring | Automated test insights | Logs, videos, performance metrics, CI/CD integration | Premium |
| PagerDuty | Incident Management & Alerting | Alerting & on-call response | Intelligent alert routing, escalation policies | Premium |
Infrastructure & Environment Monitoring (Servers, networks, hybrid/cloud infrastructure)
Infrastructure & Environment Monitoring refers to the continuous tracking, analyzing, and managing of an organization’s IT systems including physical servers, virtual machines, networks, and hybrid/cloud environments to ensure performance, availability and security while proactively detecting and resolving issues.
Prometheus
Prometheus is a go-to open-source monitoring tool trusted by DevOps teams around the world. Originally built at SoundCloud, it’s designed for reliability, especially in dynamic, cloud-native environments like Kubernetes.
What sets Prometheus apart is its powerful time-series data model and built-in query language (PromQL), which lets you track metrics with precision. It scrapes data from configured targets at defined intervals and stores it locally, making it fast and efficient even when dealing with massive amounts of data.
You can set flexible alerts, visualize data through tools like Grafana, and monitor everything from application performance to server health. Whether you’re managing microservices or traditional infrastructure, Prometheus offers the control and clarity needed to keep things running smoothly.
Zabbix
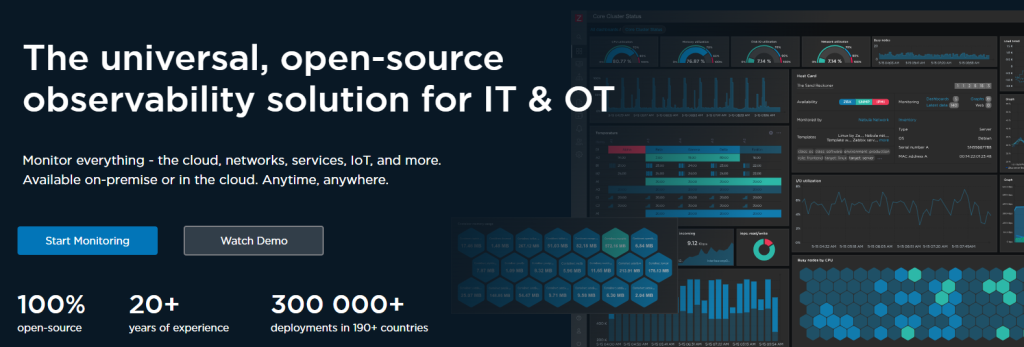
Zabbix is a powerful open-source monitoring tool trusted by DevOps teams for tracking servers, networks, and applications. It supports real-time monitoring, alerting, and visualization, making it easy to spot issues before they escalate. Zabbix shines with its flexibility by offering customizable dashboards, automated discovery, and integrations with popular DevOps tools. Whether you’re managing a few hosts or a large, distributed infrastructure, Zabbix delivers reliability and scalability without the heavy licensing costs.
Nagios
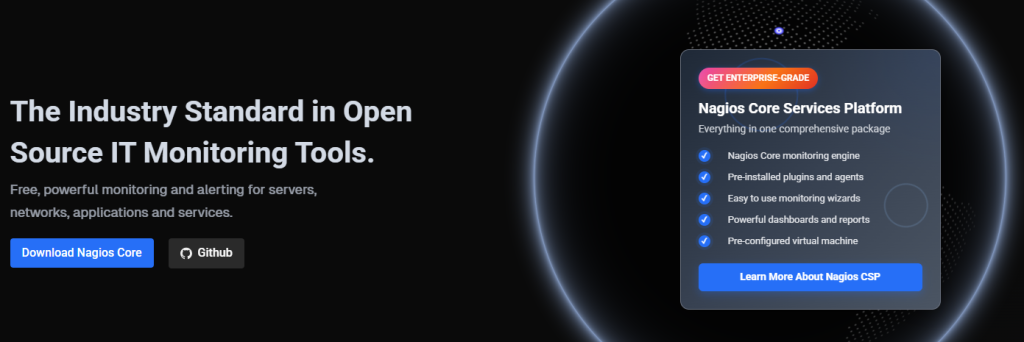
Nagios has been a trusted name in infrastructure monitoring for years and for good reason. It excels at tracking servers, networks, and applications, giving teams a clear view of system health. Its robust alerting system ensures you’re notified the moment something goes wrong, so issues can be addressed quickly.
With its plugin-based architecture, Nagios is highly flexible. You can monitor everything from basic uptime to complex custom metrics, making it a great fit for both small setups and enterprise environments. Whether you’re keeping tabs on cloud resources, on-prem servers, or hybrid systems, Nagios delivers reliability and control that DevOps teams can count on.
Icinga
Icinga is a flexible, open-source monitoring tool that keeps a close watch on networks, servers, and applications. It’s known for its powerful alerting system, which notifies teams instantly when performance drops or outages occur. With its modular architecture, Icinga integrates seamlessly with popular DevOps tools and supports custom plugins for tailored monitoring setups.
DevOps teams often choose Icinga for its scalability, it works just as well for small environments as it does for large, distributed infrastructures. Its intuitive web interface and detailed reporting make tracking uptime, resource usage, and service health straightforward. Whether you need to monitor on-premise systems, cloud workloads, or hybrid setups, Icinga delivers reliability and flexibility in one package.
SolarWinds
SolarWinds is a powerhouse in network and infrastructure monitoring, known for its reliability and deep insights. It offers a broad suite of tools covering server health, application performance, network traffic, and database monitoring all from a unified dashboard.
DevOps teams use SolarWinds to quickly spot performance bottlenecks, troubleshoot outages, and keep mission-critical systems running smoothly. Its customizable alerts, detailed reporting, and intuitive interface make it especially valuable for large or complex environments.
What makes SolarWinds stand out is its balance of depth and usability. Whether you’re tracking on-premises systems, hybrid setups, or cloud infrastructure, it delivers the visibility you need without unnecessary complexity.
Netdata
Netdata is a real-time monitoring tool designed for speed and simplicity. It offers second-by-second insights into servers, containers, applications, and databases all from a sleek, interactive dashboard. With its auto-detection of metrics and minimal configuration, you can start monitoring almost instantly.
What makes Netdata stand out is its ability to visualize thousands of metrics without slowing down your system. It’s lightweight, open-source, and perfect for troubleshooting performance issues as they happen. Whether you’re managing a single server or scaling a complex infrastructure, Netdata gives DevOps teams a clear, live view of system health without the usual complexity.
Application & Service Performance Monitoring (APM) (Application performance, transactions, business KPIs, RUM)
Application & Service Performance Monitoring (APM) is continuous tracking of application performance, user transactions, business KPIs, and real user experiences (RUM) to ensure optimal functionality, detect bottlenecks, and maintain seamless service delivery.
AppDynamics
AppDynamics is a powerful application performance monitoring (APM) platform designed to give DevOps teams full visibility into how their apps are performing in real time. It tracks everything from end-user interactions to back-end services, making it easier to pinpoint slowdowns and bottlenecks.
Key features include code-level diagnostics, dynamic baselining, AI-driven anomaly detection, and detailed transaction tracing. It integrates seamlessly with cloud platforms, microservices, and hybrid environments, making it ideal for complex, distributed systems.
What sets AppDynamics apart is its ability to connect performance data directly to business outcomes. Teams don’t just see technical metrics, they can understand how performance issues impact revenue, customer experience, and overall operations.
New Relic
New Relic is a full-stack observability platform that gives DevOps teams a clear view of their entire system from backend services to user-facing apps. It provides real-time performance metrics, error tracking, and distributed tracing, making it easy to pinpoint bottlenecks and troubleshoot issues quickly.
One of its biggest strengths is its breadth. New Relic supports dozens of integrations, works seamlessly with cloud-native environments, and provides powerful dashboards that unify logs, metrics, and traces in one place. Whether you’re monitoring microservices, optimizing API performance, or tracking user experience, New Relic offers the depth and flexibility to keep everything running smoothly.
Dynatrace
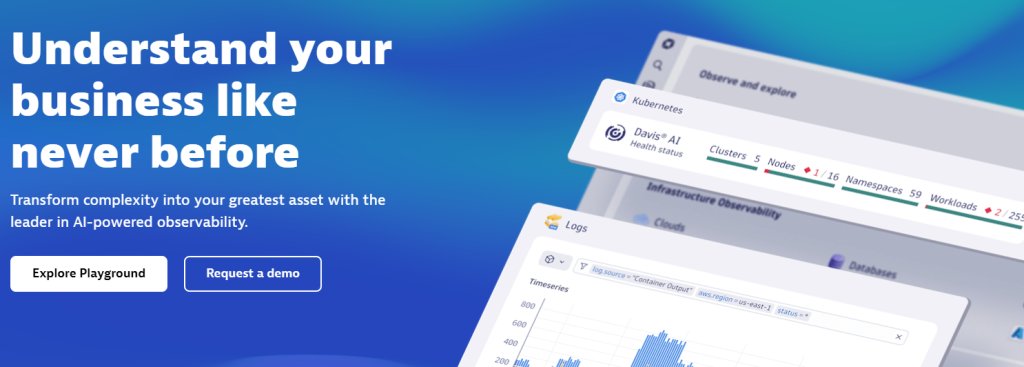
Dynatrace is a powerful, AI-driven observability platform built for complex, dynamic environments. It goes beyond traditional monitoring by using automation and machine learning to detect issues, pinpoint root causes, and provide actionable insights in real time.
Its strength lies in full-stack coverage covering infrastructure, applications, microservices, containers, and even user experience. DevOps teams rely on Dynatrace for performance optimization, cloud-native monitoring, and rapid troubleshooting in production environments.
What sets it apart is its Davis AI engine, which eliminates alert noise and offers clear, context-rich answers. Whether you’re managing Kubernetes clusters, multi-cloud deployments, or large-scale enterprise systems, Dynatrace makes problem-solving faster and smarter.
Observability & Data Analysis (Cross-domain metrics, logs, traces, visualizations, event correlation)
Observability & Data Analysis is comprehensive monitoring of cross-domain metrics, logs and traces with visualizations and event correlation to gain deep insights, identify root causes and optimise system performance across complex environments.
Datadog
Datadog is one of the most trusted names in DevOps monitoring, offering a unified platform for metrics, logs, and application performance. It provides deep visibility into cloud environments, containers, microservices, and on-premise systems all from a single dashboard.
Key features include real-time alerts, AI-driven anomaly detection, and over 600 integrations with popular tools and platforms. DevOps teams use Datadog to track application health, monitor infrastructure, and gain insights into everything from API latency to Kubernetes workloads.
What makes Datadog stand out is its ease of use combined with powerful analytics. Whether you’re debugging an issue or optimizing system performance, Datadog delivers actionable insights without overwhelming complexity.
Grafana
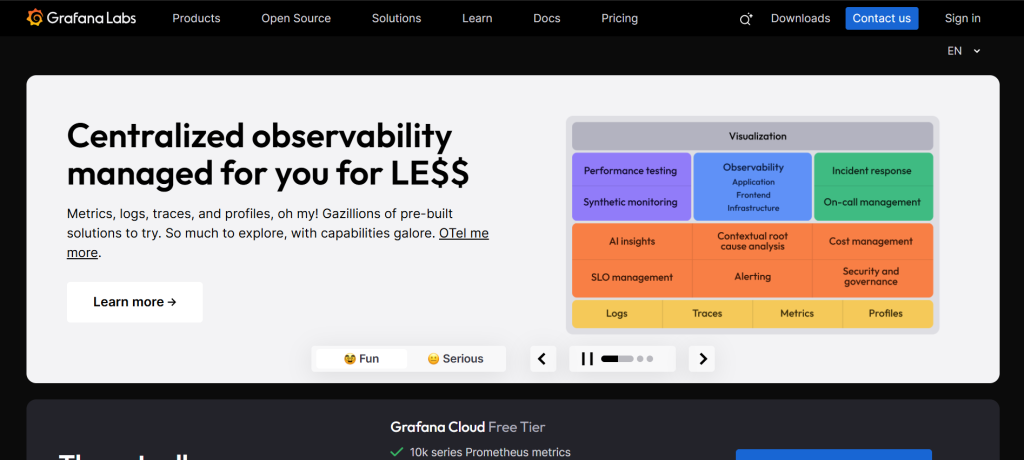
Grafana is one of the most popular visualization tools in the DevOps world, known for turning raw metrics into clear, interactive dashboards. It connects seamlessly with data sources like Prometheus, InfluxDB, Elasticsearch, and many others, making it incredibly versatile.
Teams use Grafana to monitor application performance, track infrastructure health, and analyze business metrics all in real time. Its customizable panels, powerful alerting system, and wide plugin ecosystem make it adaptable to almost any environment.
What sets Grafana apart is its flexibility and visual clarity. Whether you’re tracking server load, database queries, or Kubernetes cluster activity, it presents the data in a way that’s easy to understand and act on.
Elastic Stack (ELK: Elasticsearch, Logstash, Kibana)
Elastic Stack (ELK: Elasticsearch, Logstash, Kibana) is a powerhouse for log management and analysis in DevOps environments. Elasticsearch stores and searches massive volumes of data at lightning speed. Logstash collects, processes, and transforms log data from various sources. Kibana turns that raw data into clear, interactive visualizations.
DevOps teams use ELK for real-time application monitoring, troubleshooting, and security analysis. Its flexibility makes it ideal for everything from tracking system performance to detecting unusual activity. What makes ELK stand out is its scalability, open-source nature, and ability to handle both structured and unstructured data effortlessly.
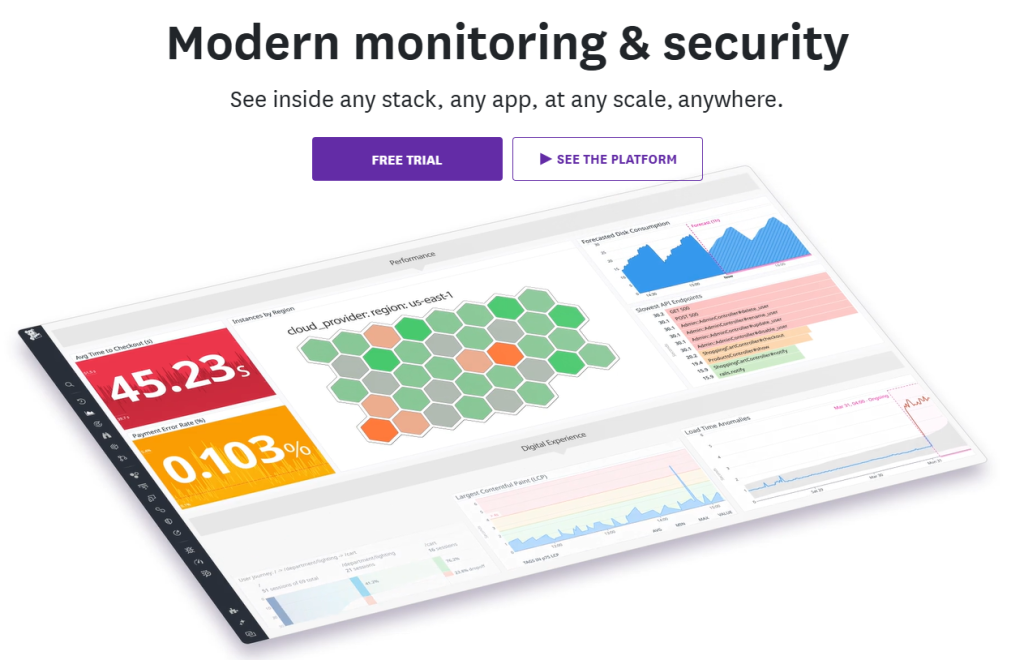
Splunk

Splunk is a powerhouse when it comes to turning raw machine data into meaningful insights. It collects and indexes logs from virtually any source like servers, applications, containers, and cloud services making it a go-to tool for DevOps teams who need a complete picture of their systems.
Its real strength lies in search and visualization. You can quickly track performance trends, pinpoint anomalies, and troubleshoot incidents in real time. Splunk’s alerting system helps teams respond to issues before they impact users, while its dashboards make complex data easy to digest.
Whether you’re monitoring infrastructure health, analyzing application performance, or investigating security events, Splunk delivers speed, scalability, and depth. That’s why it continues to be a favorite for large-scale, data-driven DevOps operations.
Sematext
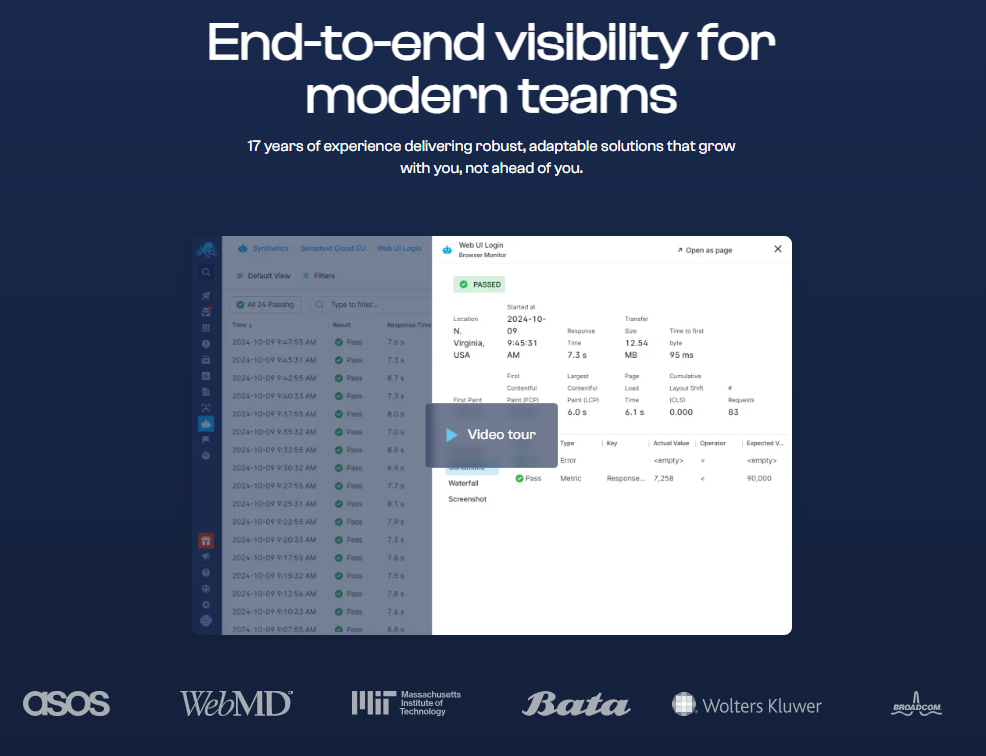
Sematext is a versatile monitoring and log management platform designed for modern DevOps teams. It offers real-time insights into infrastructure, applications, and logs all in one place. With features like alerting, anomaly detection, and easy integrations, it helps teams quickly spot and resolve issues before they escalate.
What makes Sematext stand out is its all-in-one approach. Instead of juggling separate tools for metrics, logs, and events, everything is centralized, which saves time and reduces complexity. Whether you’re managing cloud servers, containerized apps, or microservices, Sematext delivers clear visibility and actionable insights without the steep learning curve.
Honeycomb

Honeycomb is built for teams that need deep visibility into complex, distributed systems. Unlike traditional monitoring tools, it focuses on observability to help you pinpoint the “why” behind issues, not just the “what.” Its powerful query engine, heatmaps, and event-based data make it easier to investigate performance bottlenecks and unusual behavior in real time.
DevOps teams often choose Honeycomb for debugging microservices, tracing user requests, and quickly identifying the root cause of incidents. With its intuitive interface and fast query performance, it stands out as a go-to tool for modern, high-scale applications where traditional monitoring falls short.
Epsagon
Epsagon specializes in monitoring modern, distributed applications especially microservices and serverless architectures. It offers automatic instrumentation, tracing, and visualization without heavy manual setup. With real-time alerts and a clear service map, teams can quickly pinpoint performance issues across containers, functions, and APIs.
Its strength lies in end-to-end visibility. Whether you’re managing AWS Lambda functions, Kubernetes workloads, or complex microservices, Epsagon helps track every request from start to finish. This makes troubleshooting faster and keeps applications performing smoothly.
Cloud, Container & Kubernetes Monitoring (Cloud-native, orchestration platforms, container cost optimization)
Cloud, Container & Kubernetes Monitoring is continuous tracking of cloud-native environments, orchestration platforms, and containerized workloads to ensure performance, optimize resource usage, and manage container costs effectively.
Sysdig
Sysdig is built with containers and Kubernetes in mind, making it a go-to choice for modern DevOps teams. It offers deep visibility into containerized environments, letting you monitor performance, security, and compliance from a single platform.
Key features include real-time metrics, detailed service maps, runtime security, and policy enforcement. Its integration with popular orchestration platforms ensures smooth monitoring across complex deployments.
What makes Sysdig stand out is its blend of monitoring and security in one tool. Instead of juggling separate platforms, teams can track performance, detect threats, and enforce compliance without breaking workflow. It’s a powerful option for organizations running large-scale cloud-native systems.
Kubecost

Kubecost helps DevOps teams keep Kubernetes costs under control without sacrificing performance. It provides real-time visibility into resource usage, breaking down expenses by namespace, workload, or team. With features like budget alerts, cost allocation, and savings recommendations, it’s easy to spot inefficiencies and optimize spending.
What makes Kubecost stand out is its focus on financial observability for Kubernetes. Instead of guessing where resources are going, you get clear, actionable insights to balance cost and performance. For teams scaling clusters or running multi-cloud deployments, Kubecost is a must-have for keeping costs predictable.
CI/CD Pipeline & Toolchain Monitoring (Pipeline health, integration monitoring, config management)
CI/CD Pipeline & Toolchain Monitoring is ongoing monitoring of pipeline health, integrations, and configuration management to ensure smooth software delivery, early issue detection, and consistent deployment quality.
Sensu
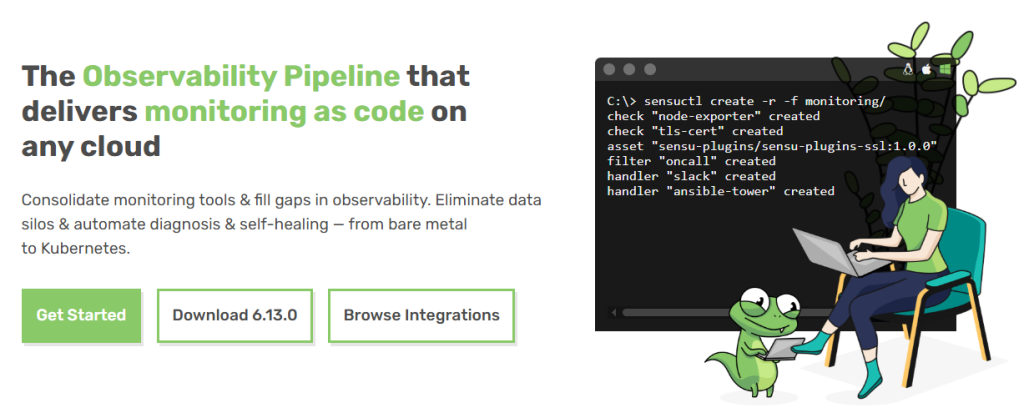
Sensu is a flexible monitoring platform built for dynamic, cloud-native environments. It’s designed to handle everything from basic health checks to complex observability pipelines. Sensu supports a wide range of integrations, letting teams collect metrics, process events, and send alerts to their preferred tools.
One of its biggest strengths is its ability to scale in fast-moving DevOps setups. Whether you’re running Kubernetes, hybrid clouds, or bare-metal servers, Sensu adapts without adding heavy overhead. With automated workflows, custom filters, and compatibility with popular alerting systems, it streamlines how teams detect and respond to issues.
Sensu stands out for its open-core approach, flexibility, and ability to integrate seamlessly with existing monitoring stacks. It’s a solid choice for teams that value customization and scalability.
Test Automation & Quality Monitoring (Automated test execution, QA monitoring)
Test Automation & Quality Monitoring is continuous oversight of automated test execution and QA processes to ensure software quality, detect defects early, and maintain reliable application performance throughout the development lifecycle.
BrowserStack Test Observability

BrowserStack Test Observability brings clarity to the chaos of automated testing. It captures every detail of your test runs logs, screenshots, videos, and performance metrics so teams can quickly pinpoint issues. Its powerful analytics highlight patterns, flaky tests, and bottlenecks, making debugging faster and smarter.
Built for modern DevOps workflows, it integrates seamlessly with CI/CD pipelines and popular test frameworks. Whether you’re running large-scale regression tests or monitoring real-world performance, BrowserStack Test Observability gives you actionable insights in real time. It stands out for its clean dashboards, deep integrations, and ability to cut investigation time from hours to minutes.
Incident Management & Alerting (On-call schedules, alert routing, incident response)
Incident Management & Alerting is proactive management of on-call schedules, alert routing, and incident response to ensure timely detection, efficient resolution, and minimal impact of system issues on business operations.
PagerDuty
PagerDuty is a go-to platform for incident management and real-time alerting in DevOps. It integrates seamlessly with monitoring tools to detect issues the moment they occur, ensuring the right team members are notified instantly. With features like intelligent alert grouping, on-call scheduling, and automated escalations, it helps reduce response times and minimize downtime.
What sets PagerDuty apart is its focus on reliability and speed during critical incidents. Whether you’re managing a microservices environment or a large-scale cloud infrastructure, it ensures incidents are resolved quickly and efficiently to keep systems protected and customers happy.
Conclusion
In the fast-paced world of DevOps, monitoring isn’t just about tracking uptime, it’s about gaining full visibility, anticipating problems, and optimizing performance at every stage of the software lifecycle. The right tools empower teams to detect issues early, resolve them quickly, and maintain smooth, reliable operations.
From open-source solutions like Prometheus and Grafana to enterprise-grade platforms like Dynatrace, Datadog, and New Relic, each tool brings unique strengths suited for different environments and needs. The key is choosing the right mix based on your infrastructure, scalability goals, and team workflows.
At Devrims, we provide comprehensive DevOps services that include designing, implementing, and managing robust monitoring solutions tailored to your infrastructure and business objectives that help you maintain peak performance and accelerate delivery.
As systems grow more complex, a strong monitoring strategy becomes non-negotiable. By leveraging the right tools, DevOps teams can ensure stability, improve user experiences, and confidently support innovation at scale.

Related Tutorials