Track Your Ecommerce Store’s Success with Google Analytics 4
- Why Track Ecommerce?
- Why use Google Analytics for Ecommerce Tracking?
- What Kind of Ecommerce Activities Can You Track on Google Analytics?
- Steps to Set Ecommerce Tracking in Google Analytics 4
- Enable Ecommerce Settings on Google Analytics
- Add Google Analytics to your Magento Store
- Insights for Maximum Success
- Conclusion
Leveraging analytics is no longer an option but is necessary for online businesses to succeed in today’s data-driven world. However, many store owners fail to enhance the power of data to optimize their operations. They miss out on crucial insights into user behavior, funnel performance, and revenue attribution without proper ecommerce tracking. This prevents them from making informed decisions to boost conversions, retention, and profits. Ultimately, the results come as slow growth, stagnation, or worse – going out of business.
Therefore, tracking should be an essential step for any serious ecommerce merchant. In this article, we will explore best practices for setting up comprehensive analytics using Google Analytics – the industry standard free tool. Specifically, we will explore how to enable ecommerce tracking features, events tracking, custom dashboards, and segmentation. These capabilities turn raw data into actionable insights to identify opportunities, diagnose issues, and guide innovative marketing and development investments. Online retailers can confidently scale while maximizing returns on their analytics investment with the proper tracking foundation.
- Why Track Ecommerce?
- Why use Google Analytics for Ecommerce Tracking?
- What Kind of Ecommerce Activities Can You Track on Google Analytics?
- Steps to Set Ecommerce Tracking in Google Analytics 4
- Enable Ecommerce Settings on Google Analytics
- Add Google Analytics to your Magento Store
- Insights for Maximum Success
- Conclusion
Why Track Ecommerce?
In today’s highly competitive ecommerce landscape, data is the fuel that powers business growth. Online merchants need to gain visibility into what is working, diagnose issues, and guide strategic decisions. Implementing comprehensive analytics delivers transparency into the entire customer journey and funnel. Store owners can pinpoint conversion bottlenecks on the homepage, product pages, or checkout. Insightful data on traffic sources quantifies the ROI of marketing campaigns and channels to double down on what drives transactions.
Beyond the numbers, analytics provides a refined qualitative understanding of customers, from demographics to interests and behavior. These insights allow retailers to identify audience segments for targeting and personalizing experiences. They can optimize site content and navigation based on what visitors search for and how they interact with pages. The level of analytics sophistication directly separates the best-performing ecommerce businesses from the rest. Tracking is the foundation to unlock untapped revenue opportunities.
Why use Google Analytics for Ecommerce Tracking?
In the fast-paced ecommerce landscape, leveraging the right tools can make or break business success. Google Analytics stands out among all the insights tools for tracking e-commerce, as it is adopted by over half of all websites. Its versatility, ease of implementation, and real-time data are the foundation for more intelligent merchant decision-making.
Moreover, the rich segmentation, custom reporting, and attribution modeling functionalities allow businesses to optimize ROI across traffic sources. Rather than guesses, data-driven insights direct the optimal allocation of budgets. Beyond quantifying revenue impact, GA provides a qualitative “voice of customer” perspective for targeted personalization efforts.
What Kind of Ecommerce Activities Can You Track on Google Analytics?
GA tracks engagement with key site pages and elements to quantify their impact on conversions. This includes product and category browsing, site search, adding items to the wishlist or cart, and initiating checkout. Retailers can also see when and where users abandon carts to win them back with targeted incentives. They get transparency into preferred payment methods, shipping options, and order volumes essential for inventory and logistics planning.
GA continues to provide value by tracking returns, exchanges, and refunds, which indicate post-purchase product performance issues. User behavior across devices and channels paints a cross-channel view of shopping habits. Segmenting users by these actions reveals profile commonalities to optimize targeting and personalization. It delivers the comprehensive intelligence online merchants need to make strategic decisions with its unparalleled analytics coverage.
Steps to Set Ecommerce Tracking in Google Analytics 4
Google Analytics is here to help you learn how your online store is performing and understand your customers better. You can unlock an inventory of data to guide your business decisions by integrating this free insights tool into your ecommerce platform. Let’s see how to set ecommerce tracking in GA4 step-by-step:
Create a Google Analytics Account
- To create a GA account, go to analytics.google.com and sign up with your email, or if you have already signed up, log in.
- Once at your profile dashboard, navigate to the admin panel in the right-bottom corner.
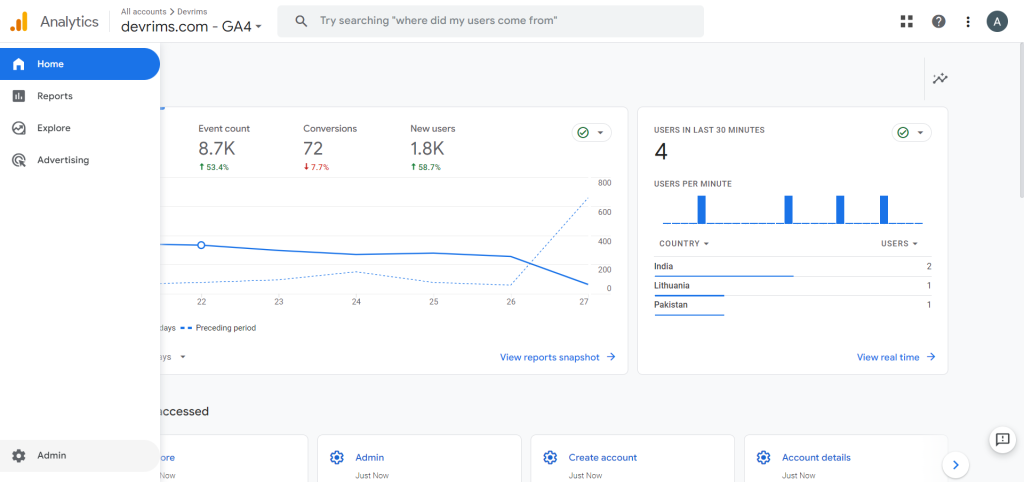
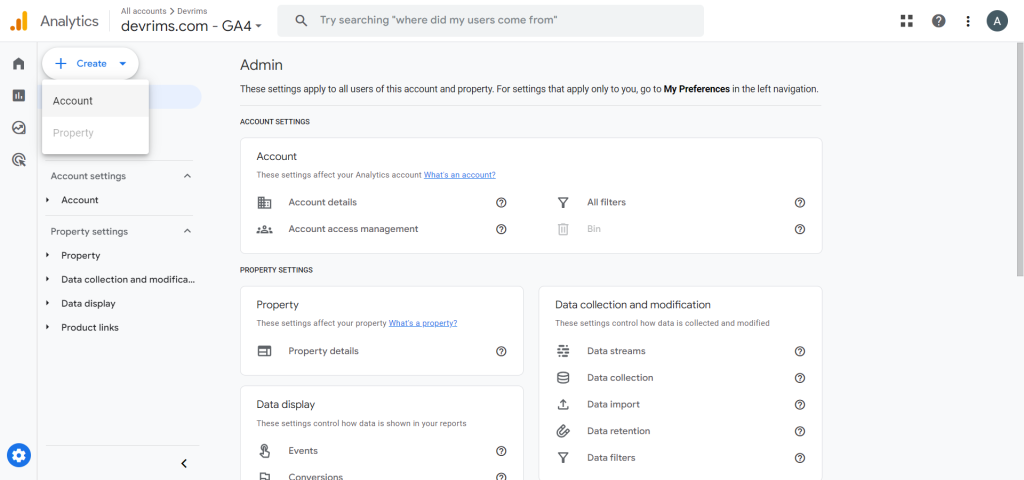
- Click the “Create” drop-down button and select the “Account” option.
- Enter a new account name in the field.
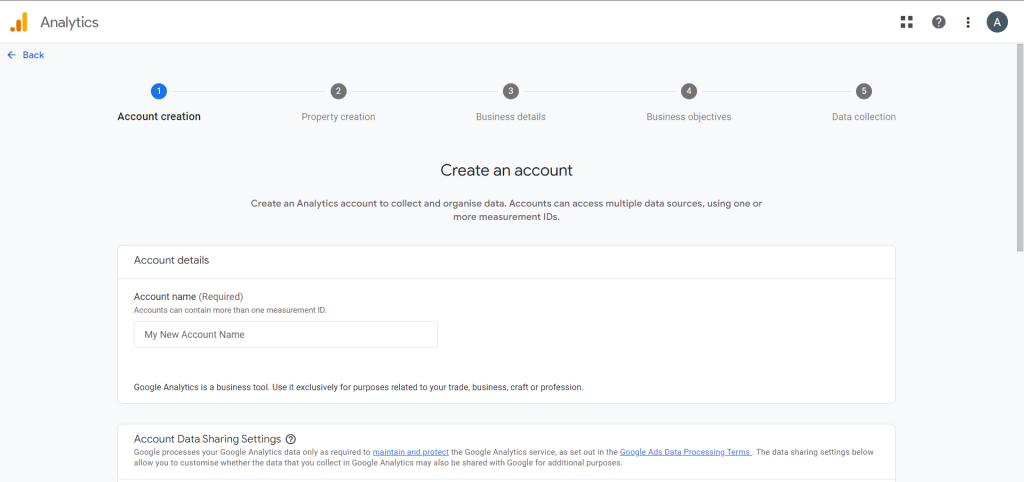
- Scroll down and check the options you want to enable in your insights. Once done, click on the “Next” button.
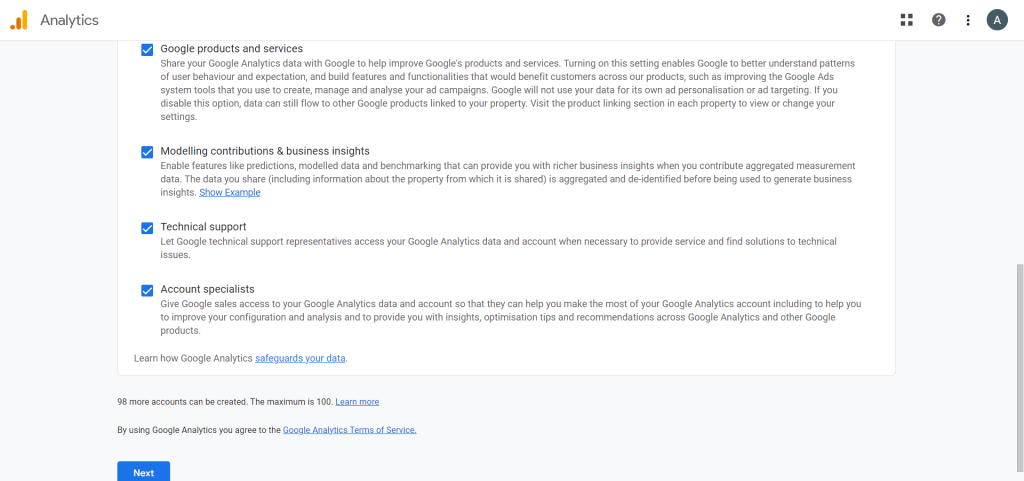
- Add property details, including the property name, reporting time zone, and currency, and click the “Next” button.
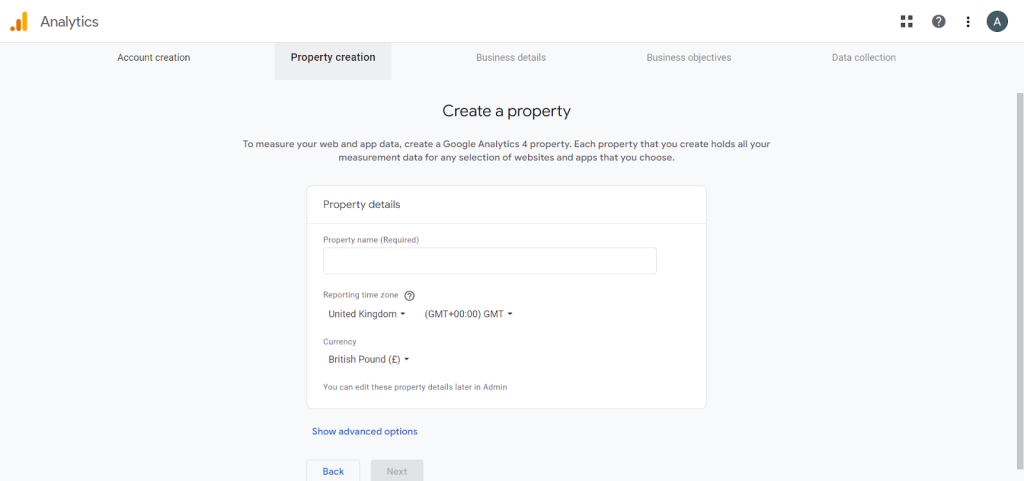
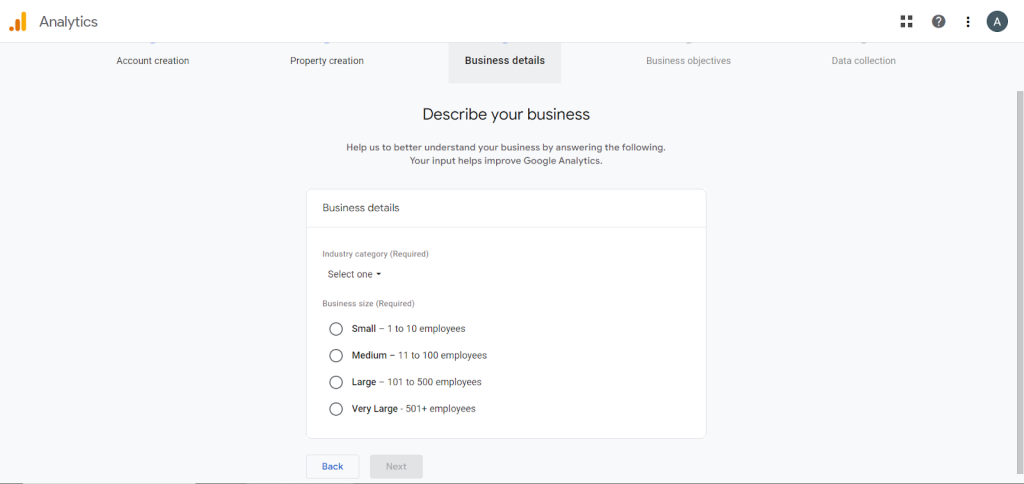
- Describe your business details by selecting an industry category and specifying the size. After that, click on the “Next” button.
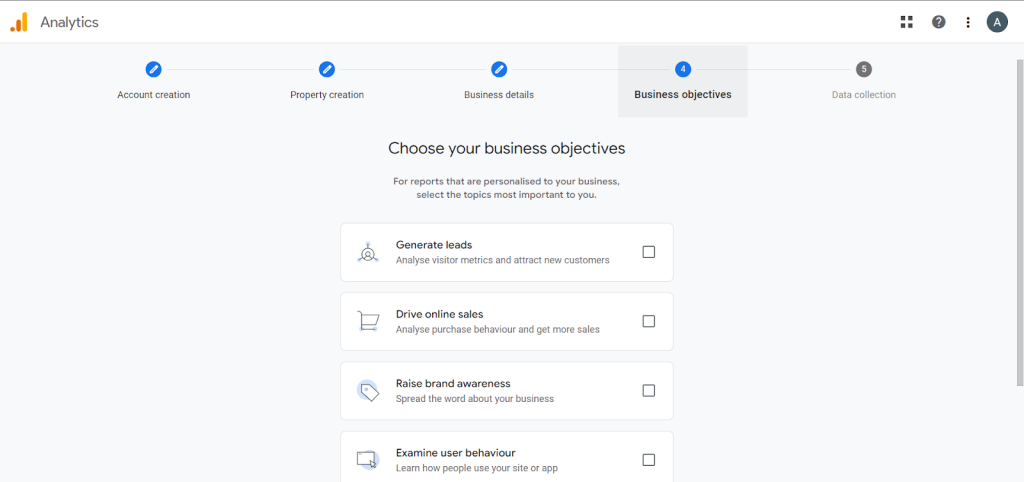
- Check the options you consider for your business objectives and click the “Create” button.
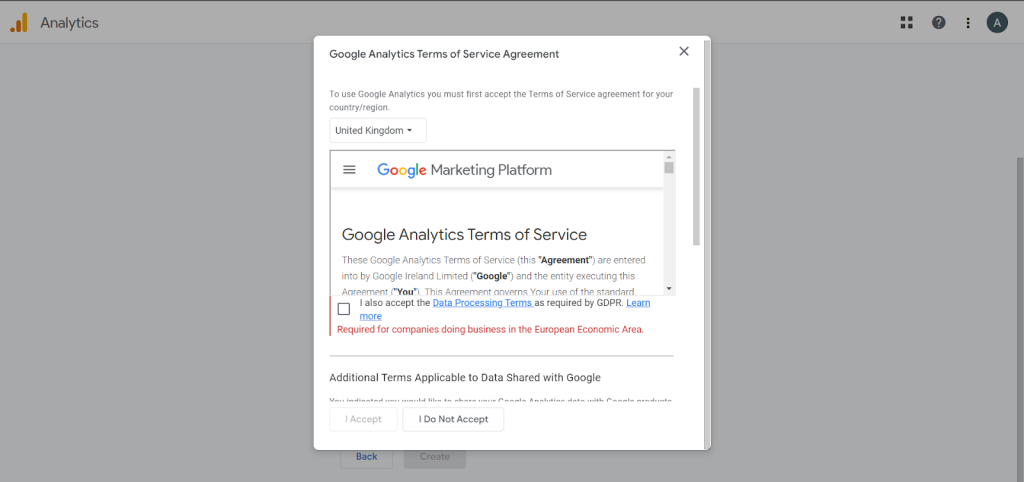
- A privacy policy page will pop up. Check the boxes and click the “I Accept” button to accept all the terms and conditions.
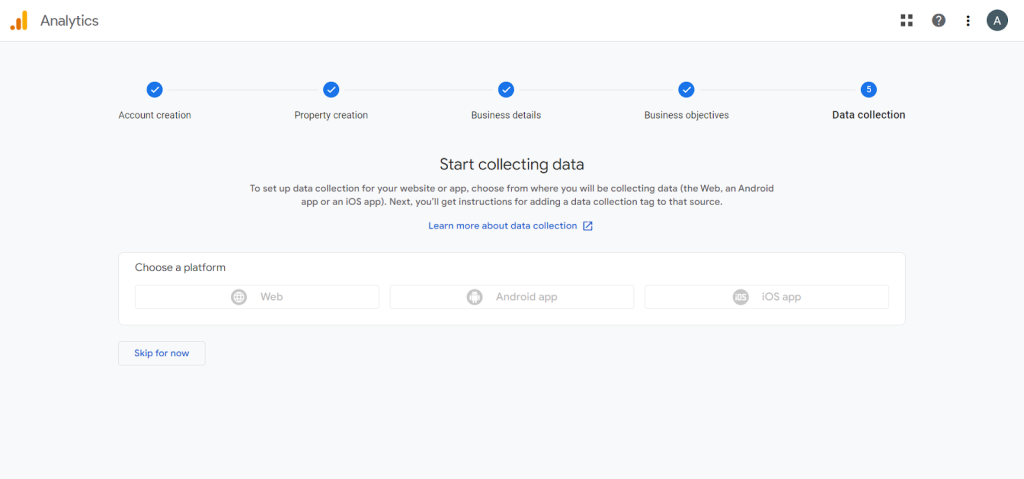
- Here you go! We are done creating an account on GA. Now, specify a device type from where you want to collect the data or skip it for now if you do not want to specify. I will select the “Web” data stream to collect data for my e-commerce site.
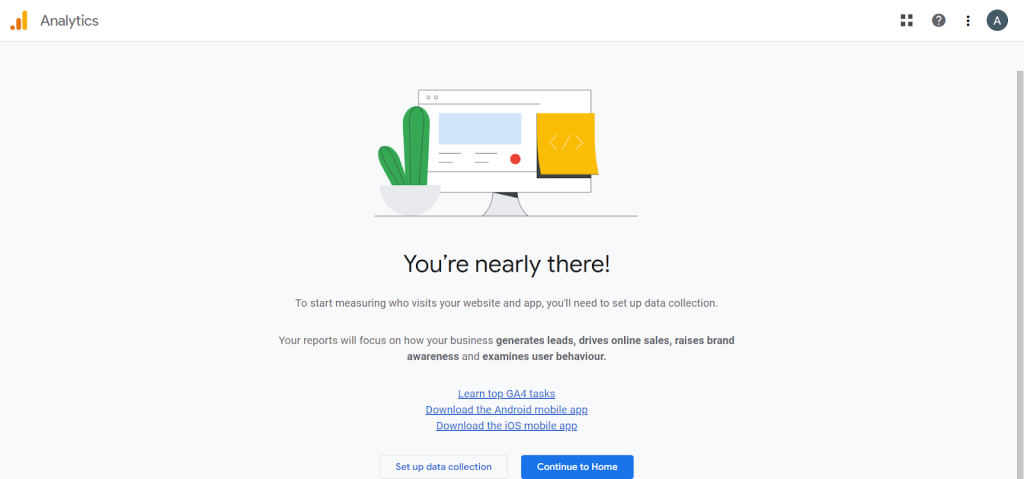
- Click on the “Continue to Home” button. In the next section of this blog, I will show you how to set up data collection. So, for now, let’s go to the home page.
- You will see an error message at the top that says you are missing data streams. This is because we did not select one when asked. I skipped that step for that time to go with the “Web” data stream. You will not get that error message if you have selected it before.
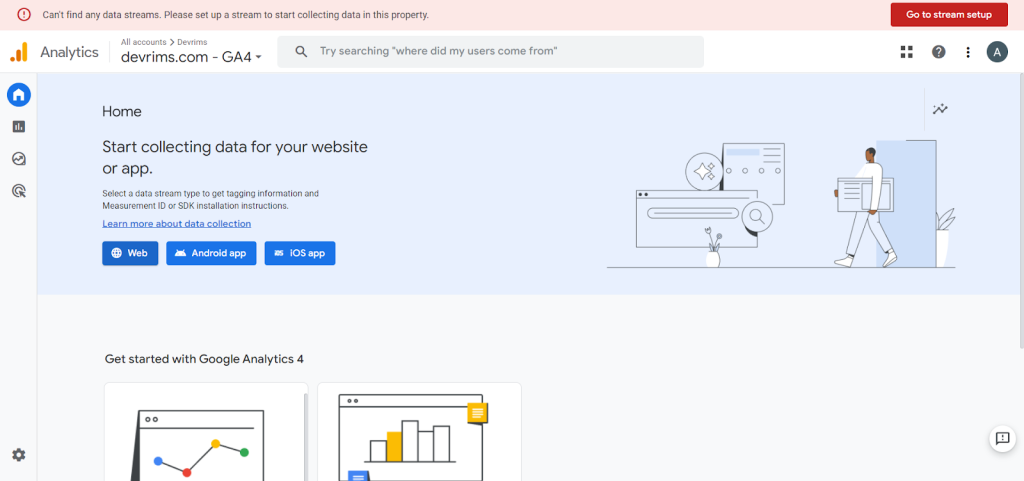
- Enter your ecommerce website’s link and name here, then click the “Create Stream” button.
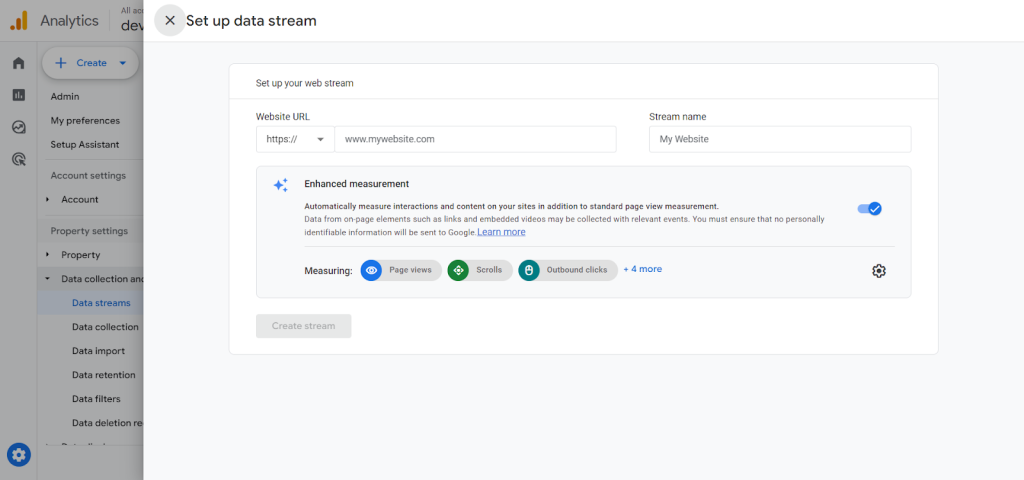
- It will pop up a new window with all the details mentioned, including the stream name, stream URL, Stream ID, Measurement ID, and more. You can see an alert message at the top. Click on the “View tag instructions” button.
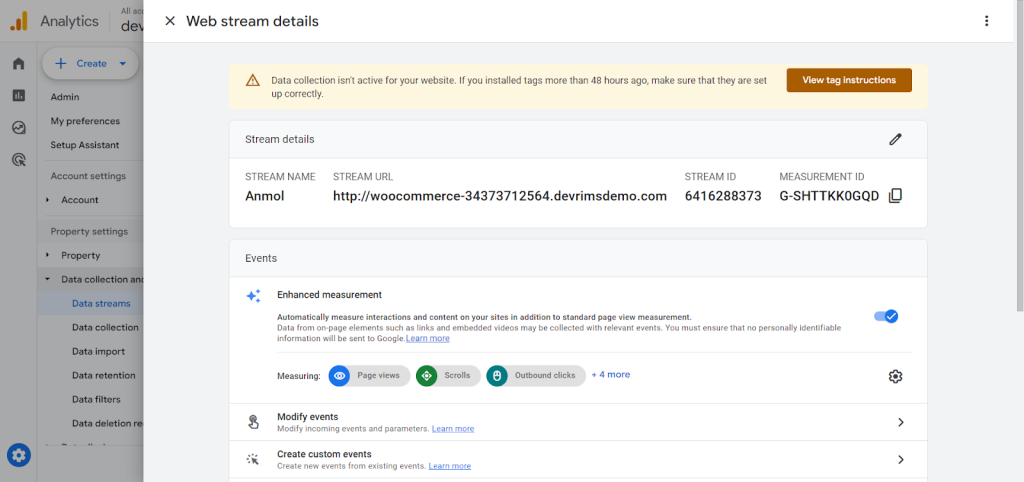
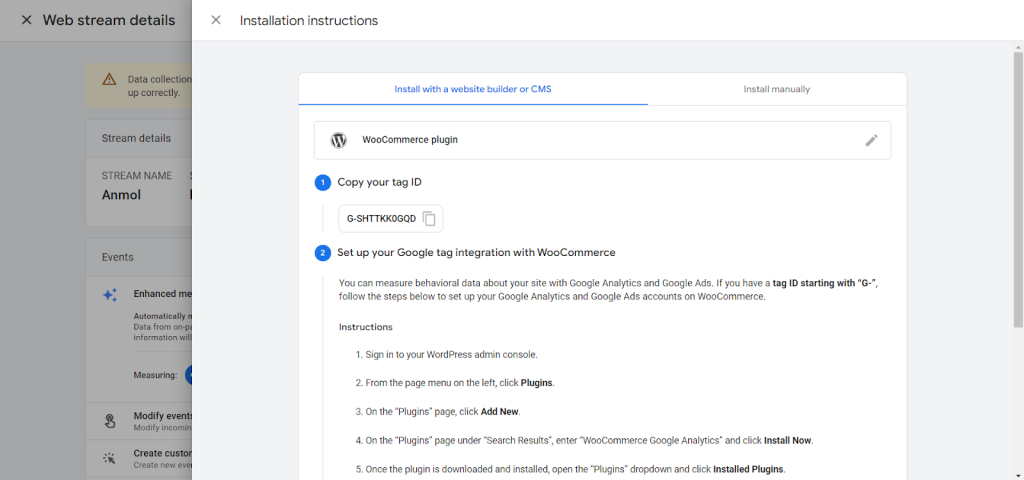
- You will get the tag ID to install with a website builder or CMS and a Google tag code to install manually.
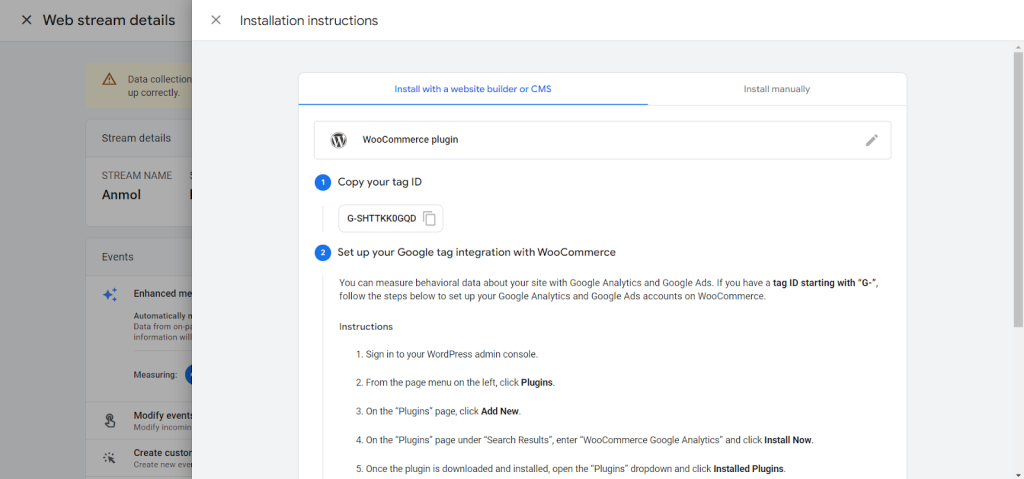
- Instructions for adding it to your ecommerce platform are also mentioned below.
We will add this to our website to enable Google Analytics to start collecting data using either of the ways after customizing the different metrics and completing the steps of setting ecommerce tracking to GA4.
Add Google Analytics to your WooCommerce Store
There are two main methods for adding Google Analytics tracking to a WooCommerce store:
Manually Adding the Tracking Code to the WooCommerce Website:
- You will need the tracking code to add GA4 to your WooCommerce store.
- Go to your Google Analytics home and navigate to the “Admin” section at the bottom of the left sidebar.
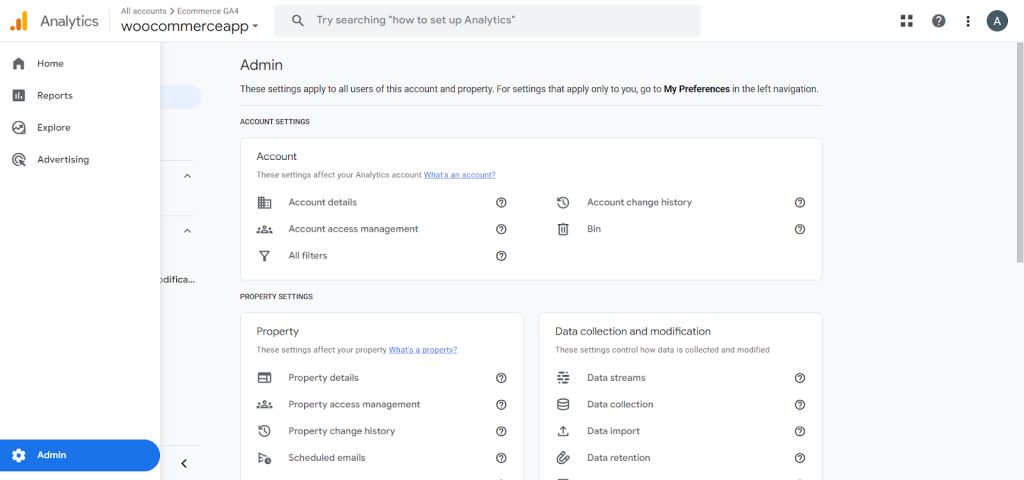
- Go to the “Data Streams” section and open your data stream.
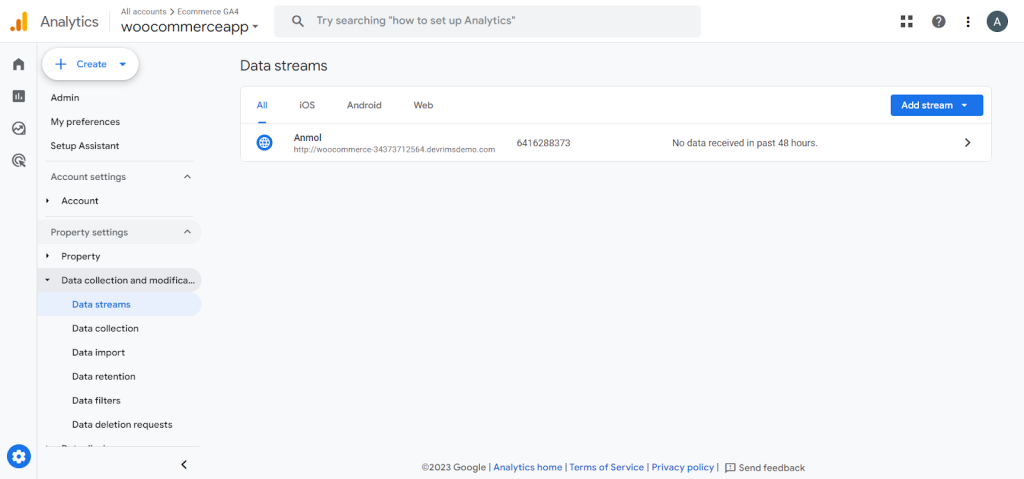
- Click the “View tag instructions” and then the “Install Manually” tab.
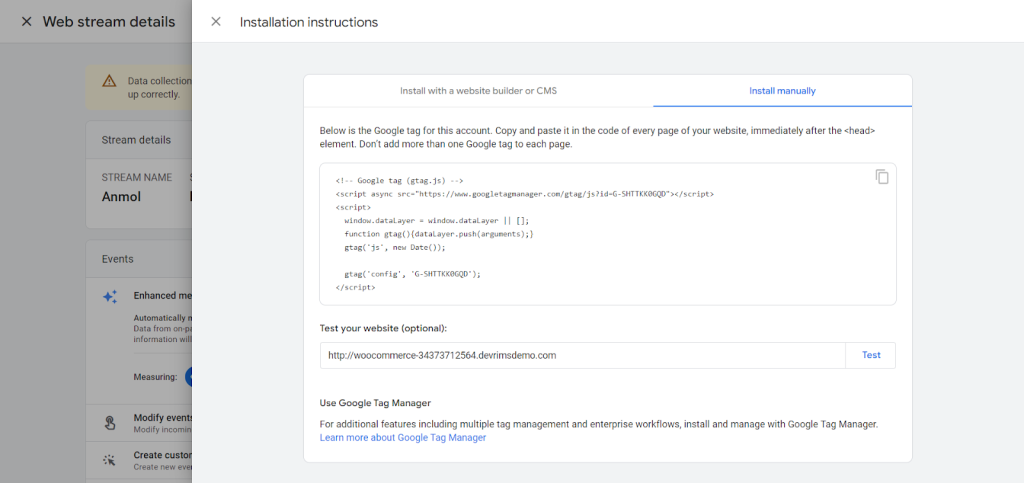
- Copy the given Google tag code from here and paste it into the header or footer of your WooCommerce store.
- Go to your WordPress WooCommerce dashboard and navigate to the Appearance>Theme File Editor.
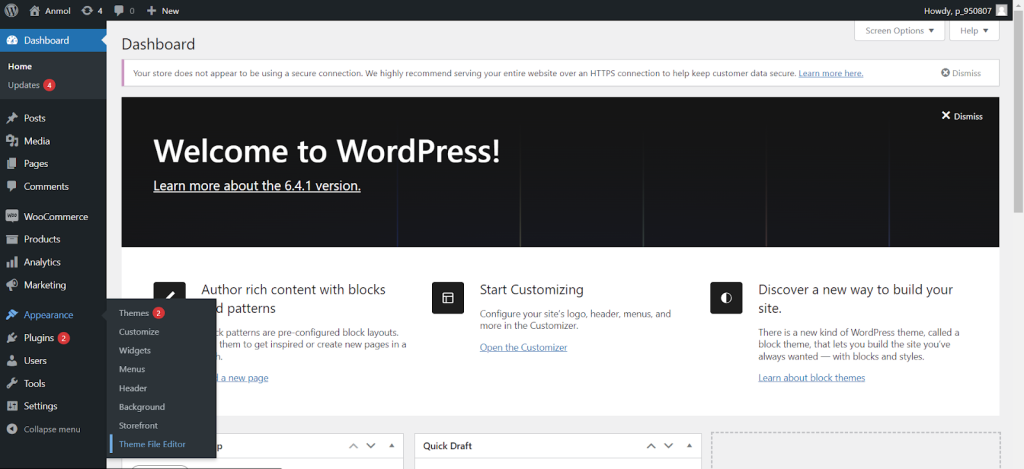
- Open the header.php or footer.php file and add the code before the closing tag </head> or </footer>.
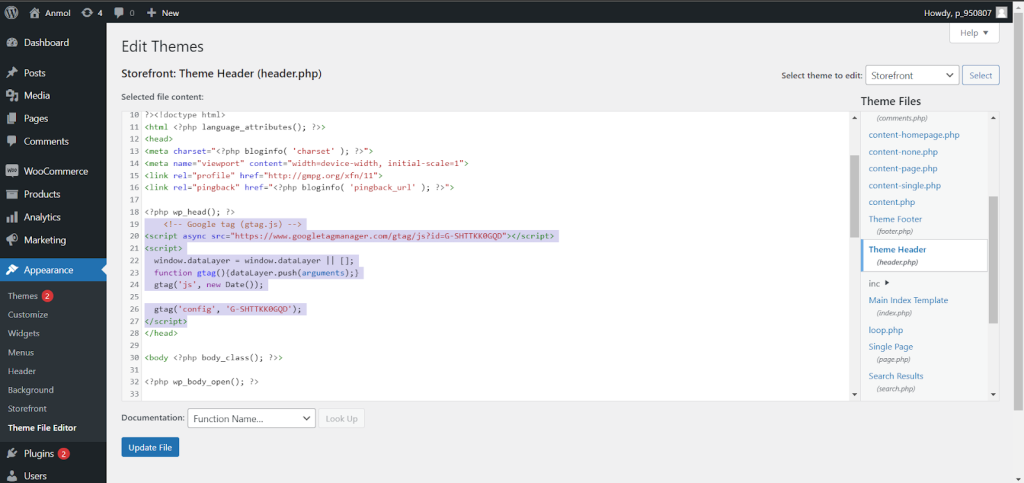
- After adding the code, click the “Update File” button to save it. You will see a message saying, “File edited successfully.”
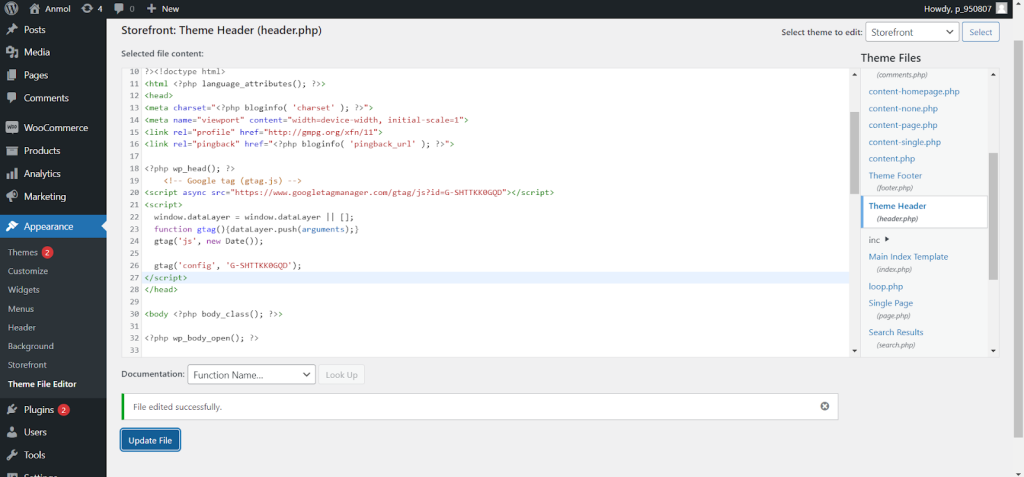
Google will automatically pull data into your GA4 property.
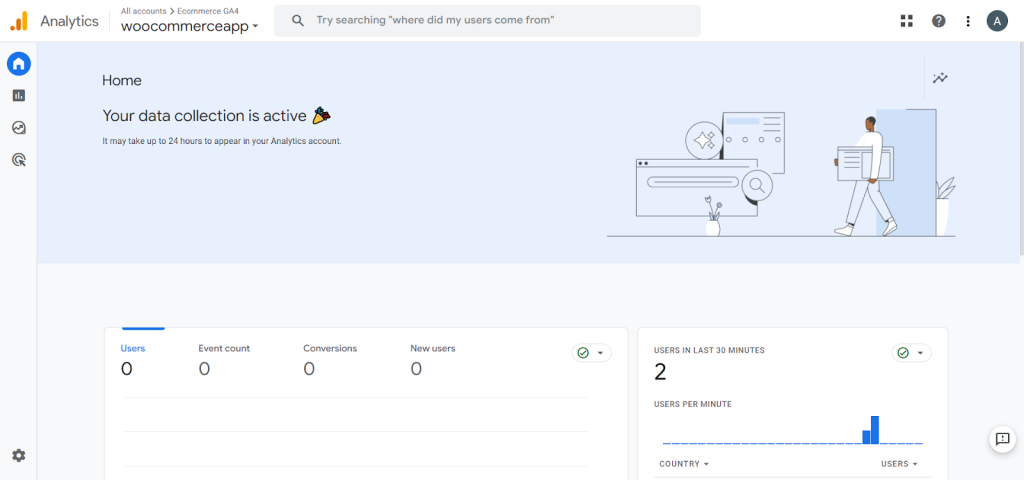
- Go to your Google Analytics 4 Home page and refresh it. At the top, you will see the status “Your data collection is active. It may take up to 24 hours to appear in your Analytics account.”
- Open your website on different devices or in guest mode to determine whether Google Analytics collects data.
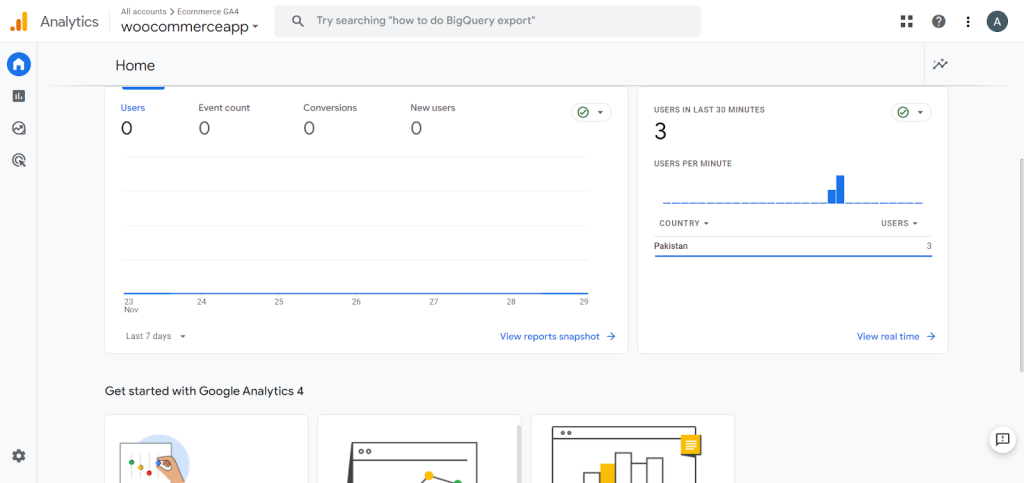
Here you go. I opened my website’s link in three different browsers in guest mode. Here, you can see that we are getting real-time data from the website, including the number of users and locations from where they are coming.
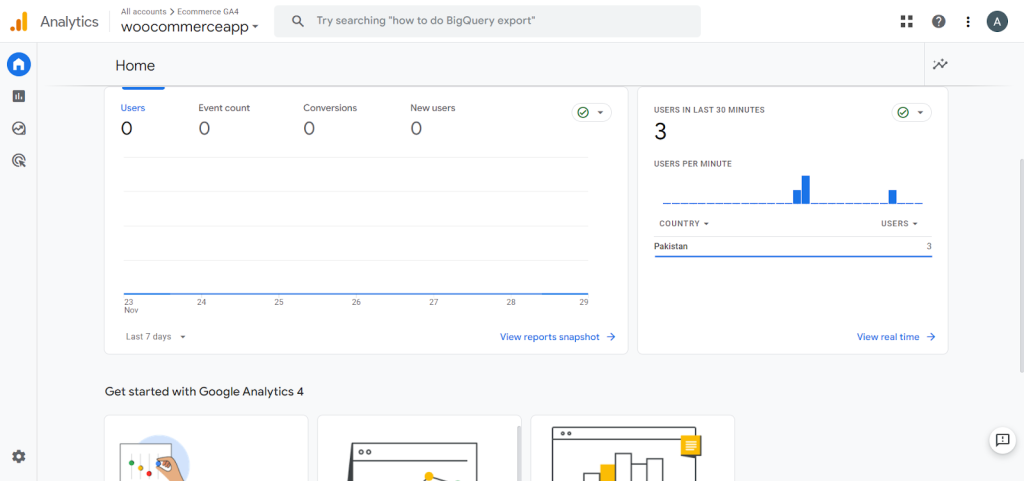
We have successfully added GA4 tracking manually to our WooCommerce store.
Adding the Tracking Code to the WooCommerce Website using a Plugin:
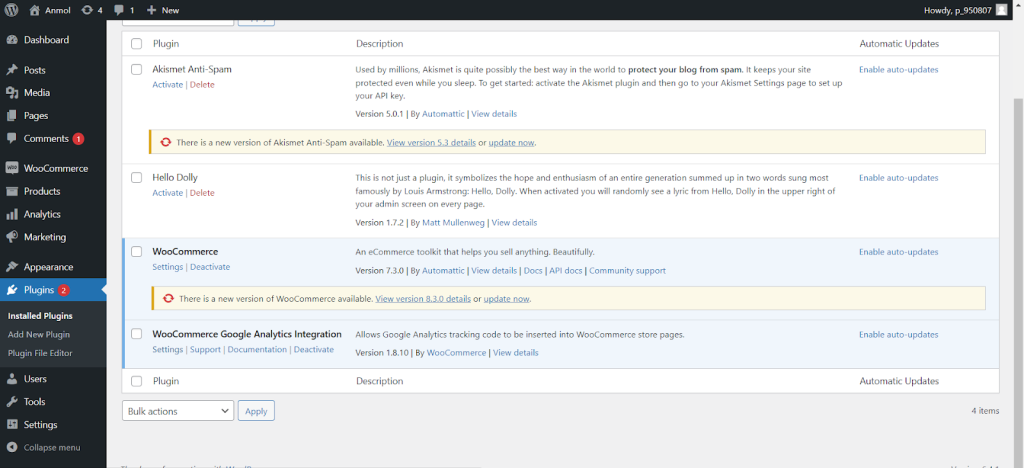
- To add the tracking code to the WooCommerce website using a plugin, go to your WordPress WooCommerce dashboard and navigate to the Plugins section on the left sidebar.
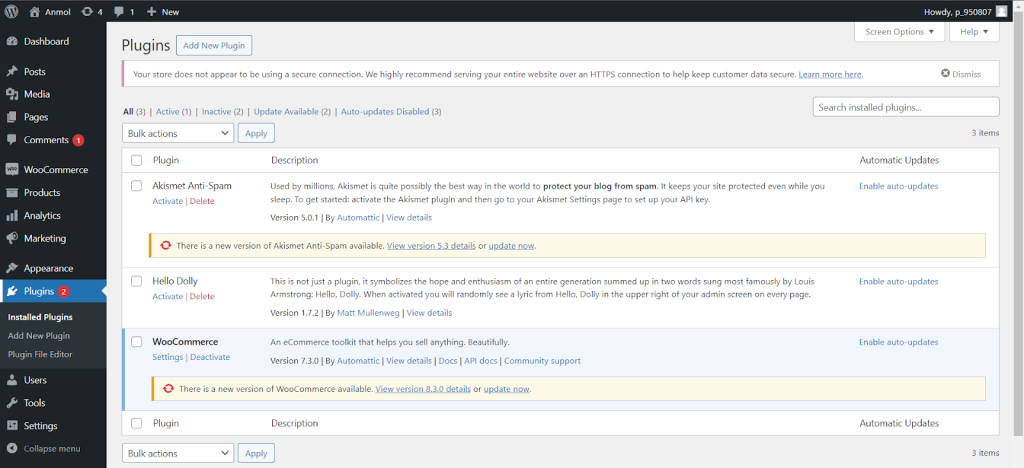
- Now, click the “Add New” button and search for the “WooCommerce Google Analytics Integration” plugin.
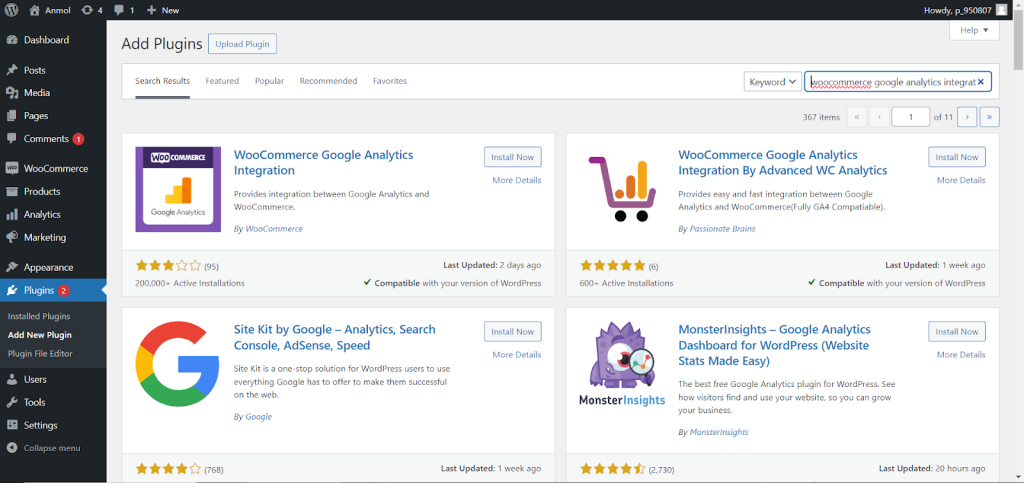
- Click the “Install Now” button and wait for it to complete. Then, click the “Activate” button to activate the plugin on your site.
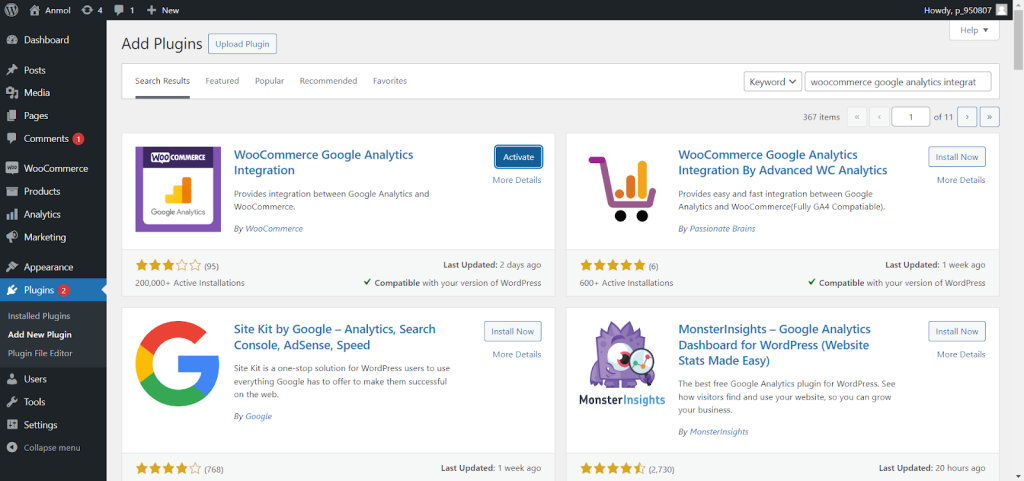
- Once done, copy the tag ID to the data stream section on your GA4 property.
- Now, go to the settings section of the plugin.
- Paste the tag ID in the “Google Analytics Tracking ID” field and scroll down to the end.

- Check the box “Enable Enhanced eCommerce” and click on the “Save” button at the bottom of the page for tracking to start sending data to your GA4 property.
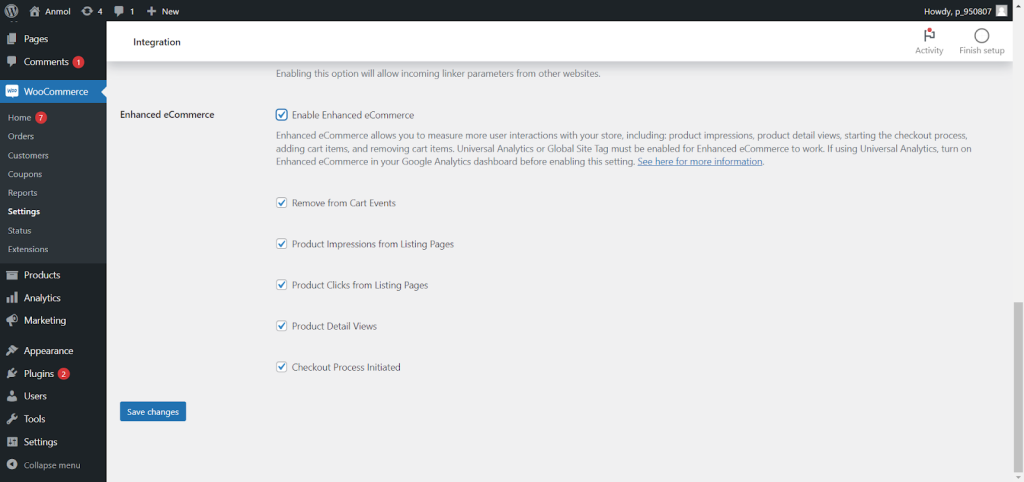
- Go to your GA4 home page to see the states.

Here you go! We are done adding the GA tracking code to the WooCommerce website using a plugin.
Implementing one of these integration methods will enable you to collect data on your WooCommerce store’s performance through Google Analytics. This will let you track metrics like traffic sources, top pages, conversion rates, and more.
Enable Ecommerce Settings on Google Analytics
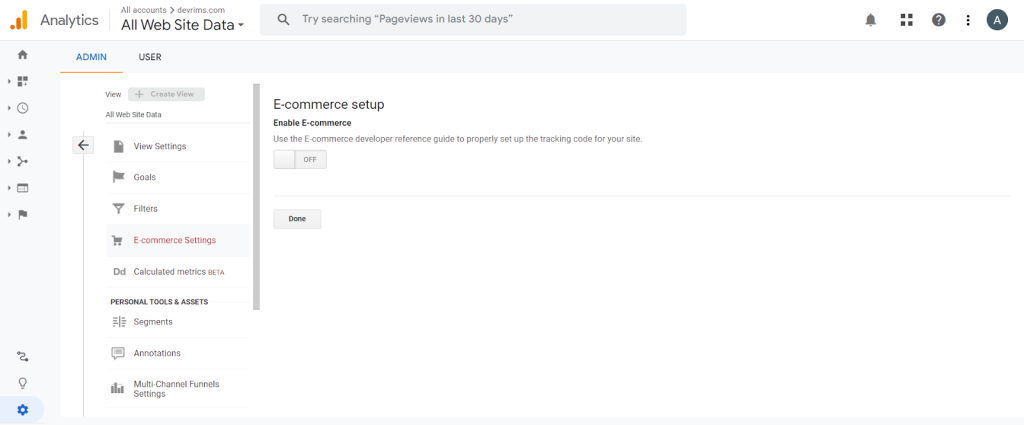
In your Google Analytics account, navigate to Admin > Ecommerce Settings and enable Ecommerce Tracking. Set the currency your ecommerce store uses, then save the settings. By enabling Ecommerce Tracking, you can add and track user funnels within Google Analytics, providing deeper insights into your ecommerce store’s performance.
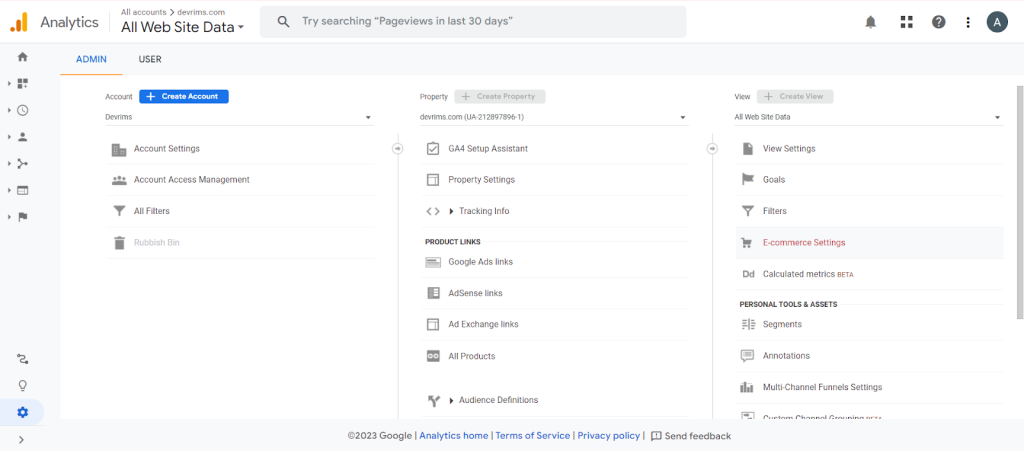
Add Google Analytics to your Magento Store
Magento offers a built-in module to add Google Analytics. All the other steps will be the same for Magento to set up a GA account and customize things. Follow these steps to add Google Analytics to your Magento store.
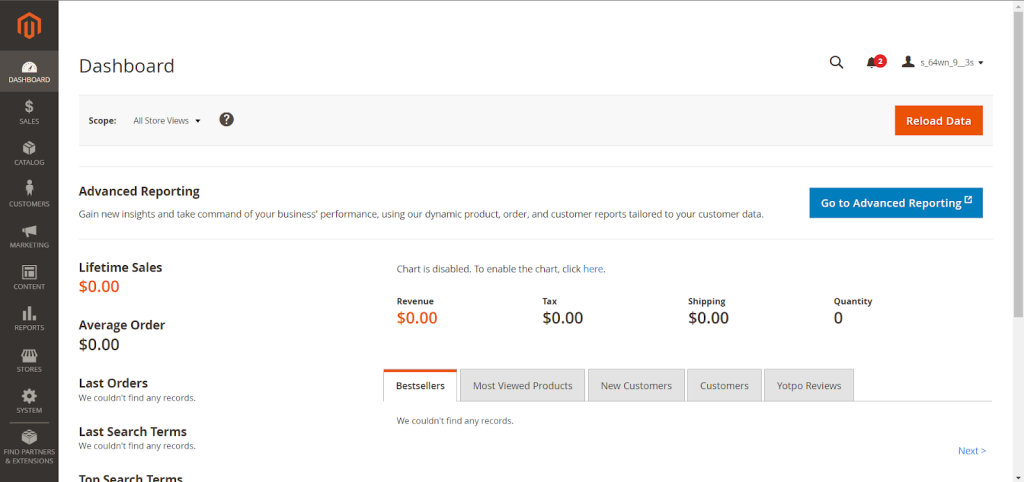
- Go to the Magento admin panel to add Google Analytics to your Magento store.
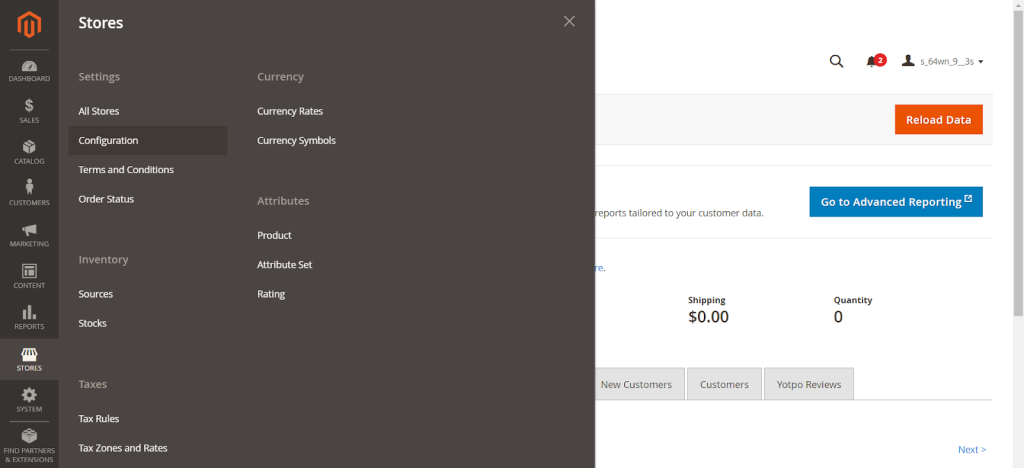
- Navigate to the Stores>Configuration section on the left sidebar.
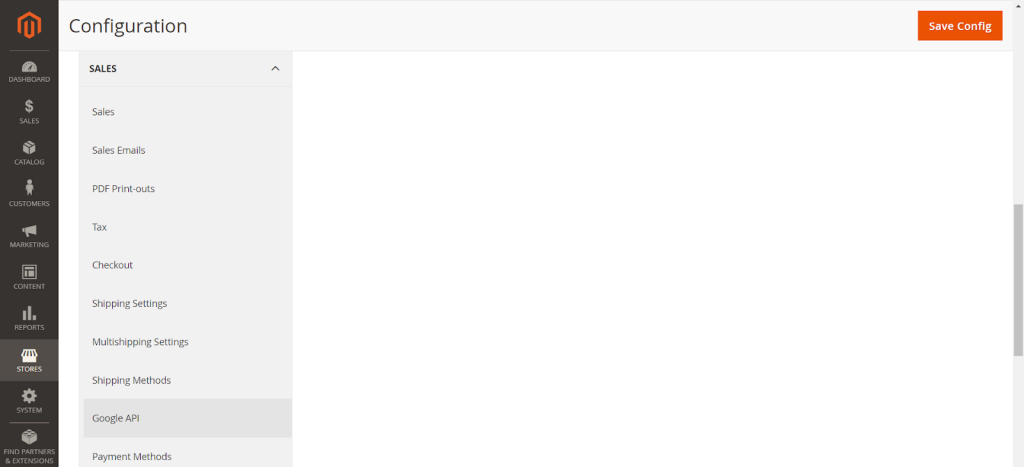
- Scroll down to expand the sales section and select the Google API option.
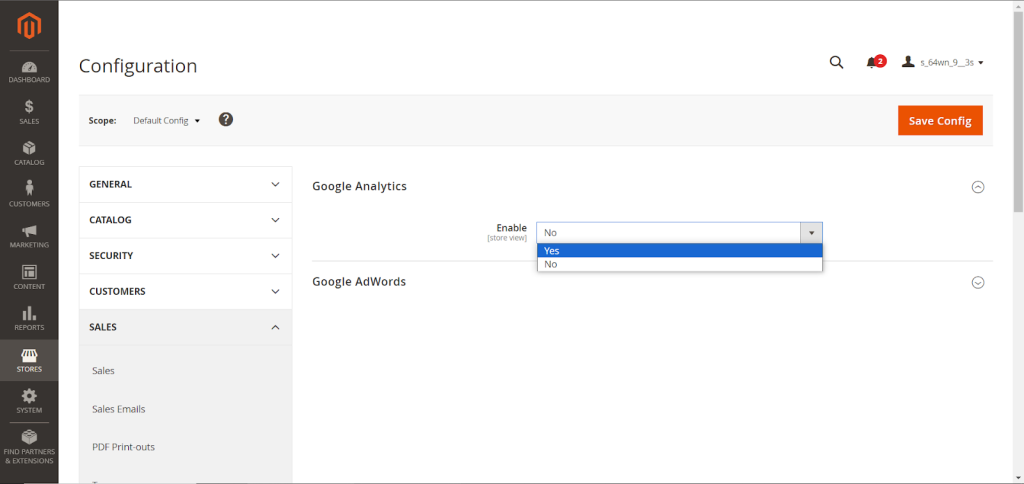
- Expand the Google Analytics section and choose the “Yes” option from the Enable drop-down menu to enable analytics settings on your Magento store.
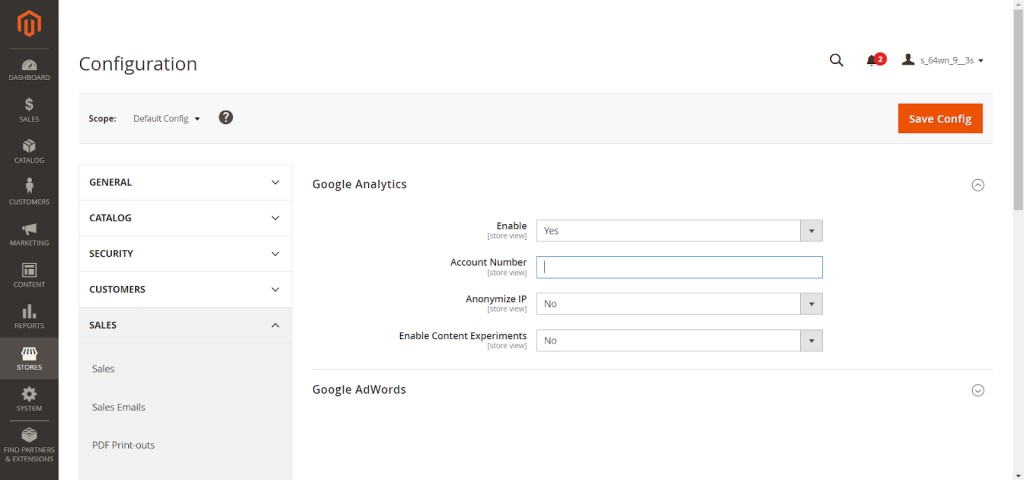
- Add the GA4 Tracking ID into the “Account Number” field, enable the “Anonymize IP,” and enable Content Experiments to say yes if needed.
- Once done with the configuration settings, click on the “Save Config” button on the top right side to save your changes.
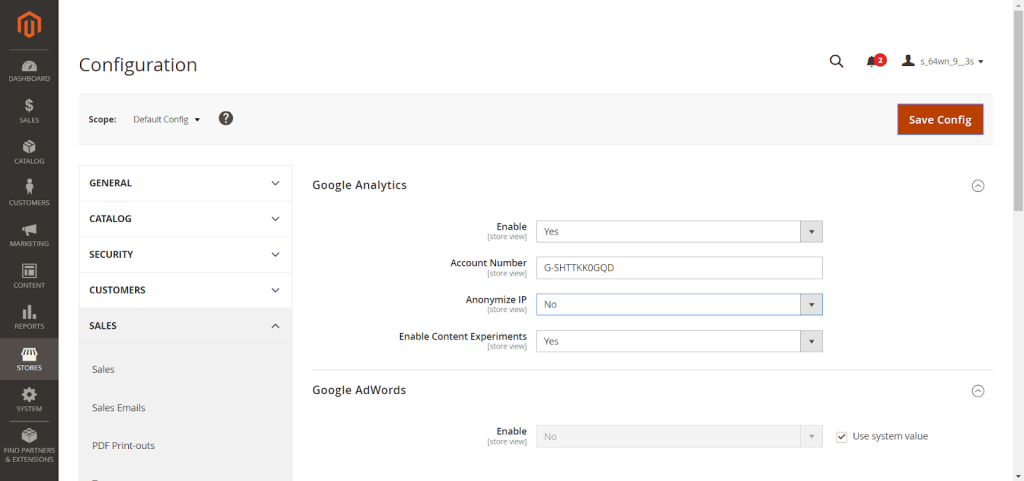
This will enable adding the tracking code to collect analytics data. This is how we can add Google Analytics to an ecommerce site. Let’s customize Google Analytics metrics to get more advanced insights into the online store.
Build Custom Reports
- Go to your GA4 property dashboard and navigate to Customization > Custom Reports section to build custom reports.
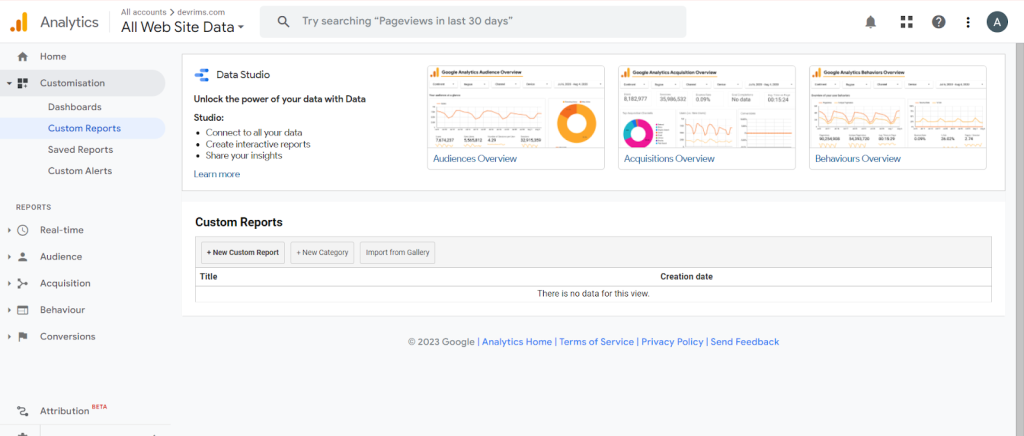
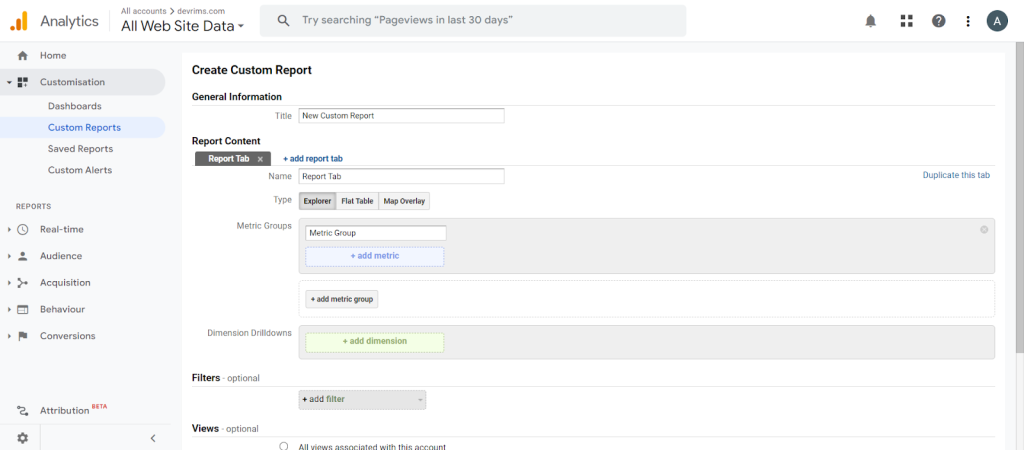
Analytics offers pre-made reports, but you can create customized dashboards to track metrics like sales, traffic sources, top products, user engagement, and more.
Segment Your Audience
Dividing users into groups by location, interests, or purchase history allows you to understand behavior better and serve targeted content.
- To segment your audience, go to your GA4 Home and navigate to the reports section on the sidebar.
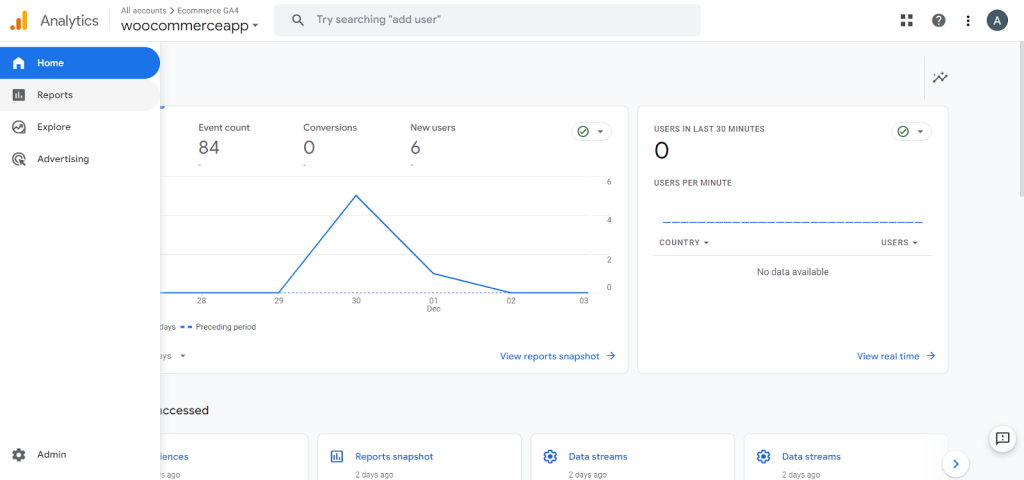
- Now, go to the Audiences section and scroll down. You will see a “+” sign right to Audience in the column. You need to click on that sign.
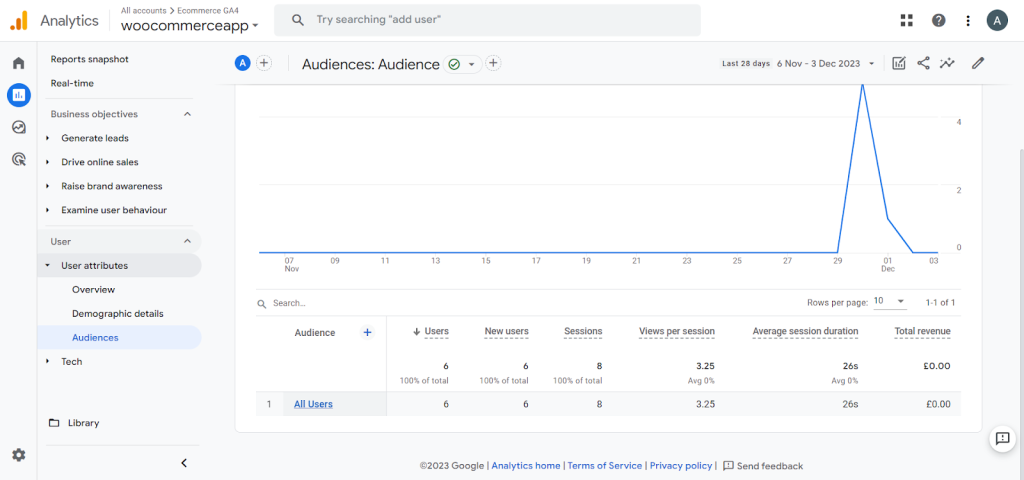
- You can see all the options to segment your audience.
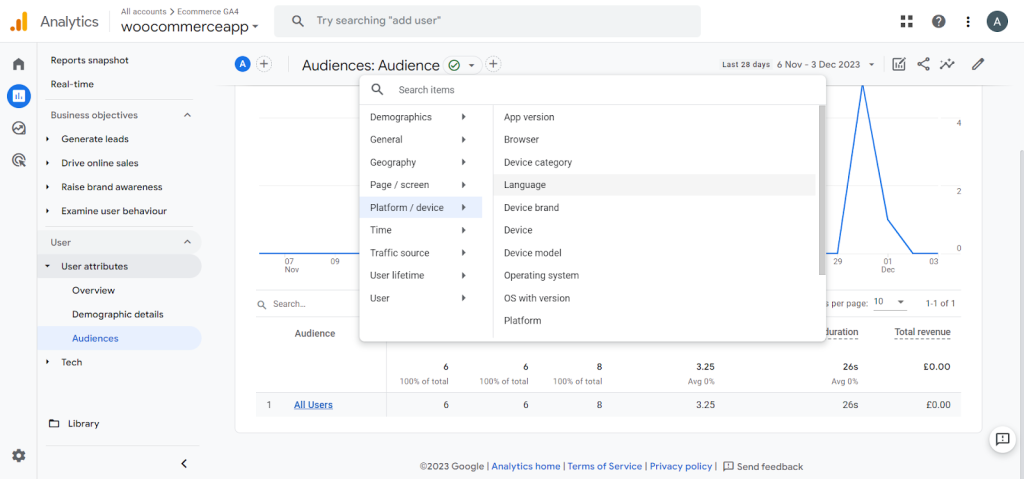
- Select any option you want to segment your audience with. Here, you can see that the segment has been added.
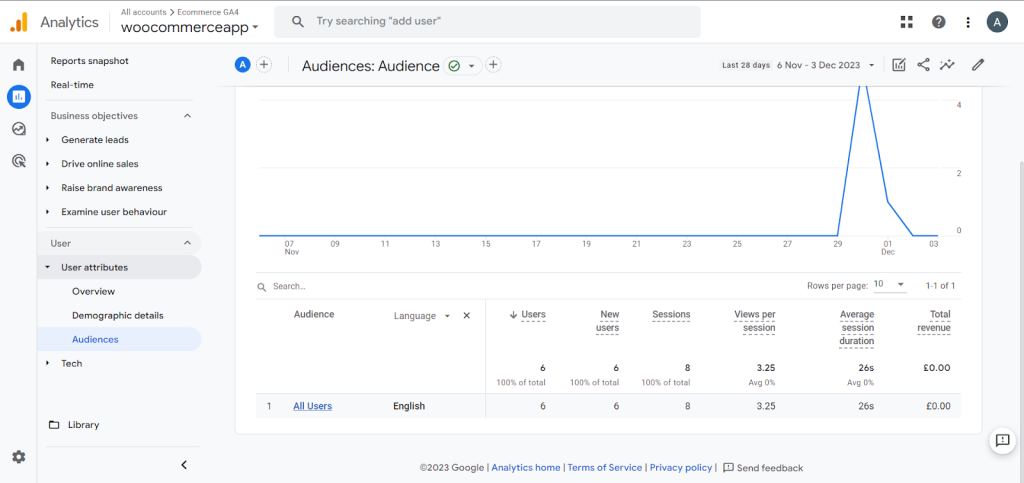
- You can also filter out the results you get with segment conditions. To do that, click the “Add filter” button at the top. Click on that and set the dimensions to group users into, such as age, location, gender, etc.
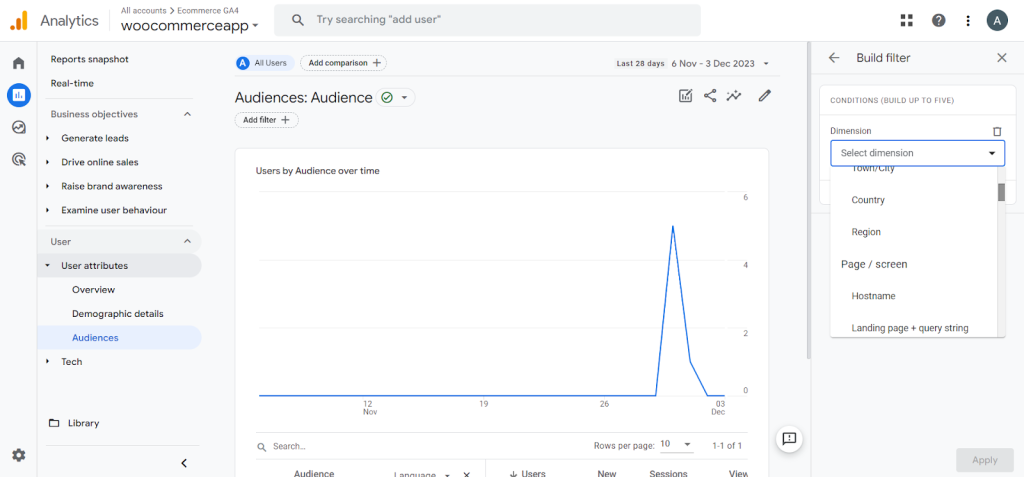
- Select the match type.
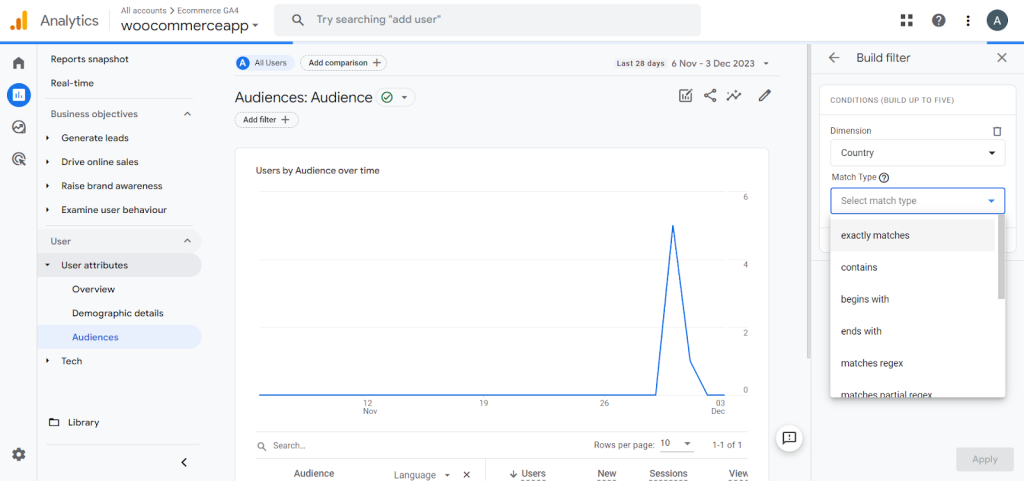
- Select the dimension values. You can select multiple-dimension values.
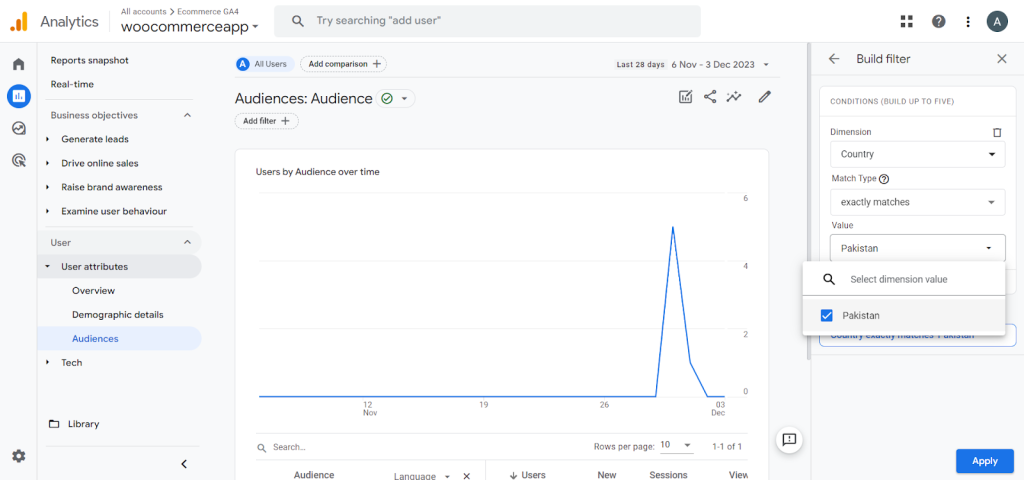
- You can add a new condition by clicking the “Add new condition” button.
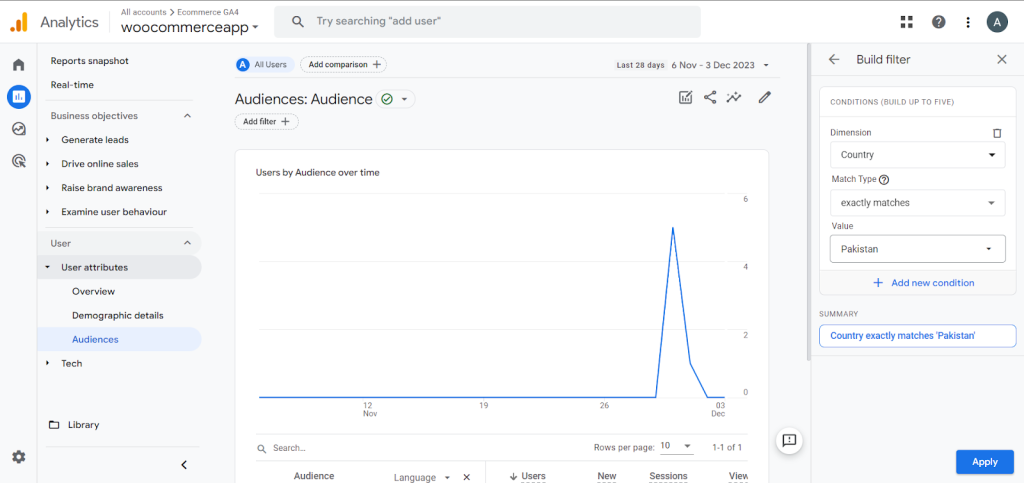
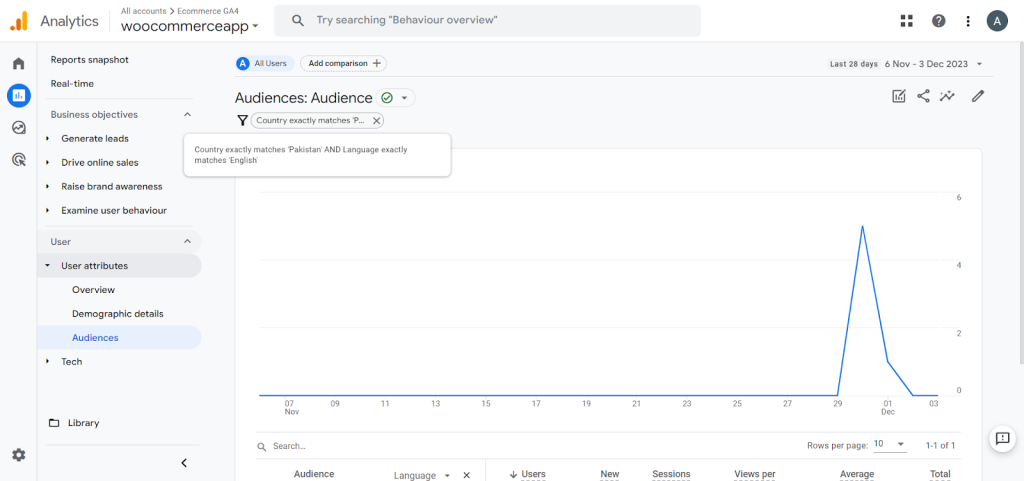
- If you add multiple conditions, it will group the users that match all the conditions. For example, we have added a segment that groups users by country of residence. Now, we will add a new condition called language.
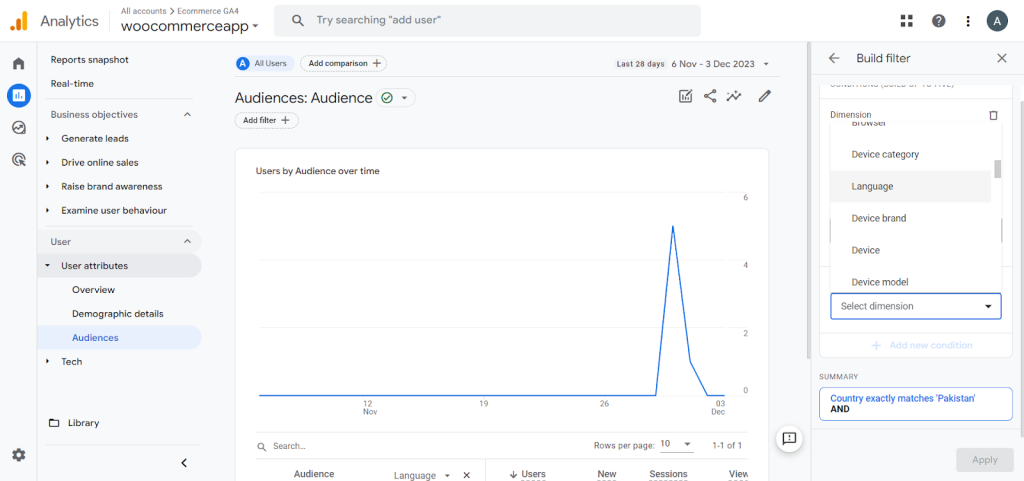
- Select the constraints that match the type and value.
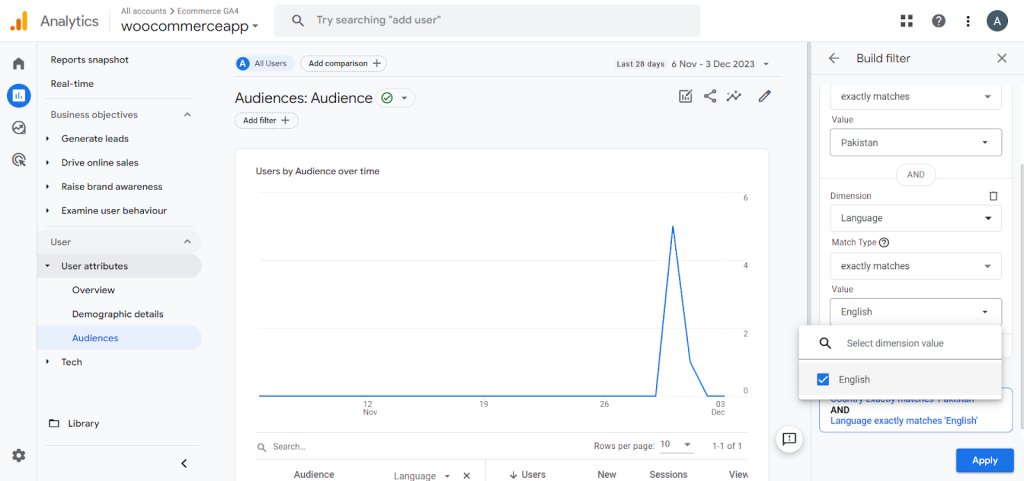
- You can see the segmentation you added in the summary if it is what you want. Once done, click the “Apply” button to see the results segment audience.
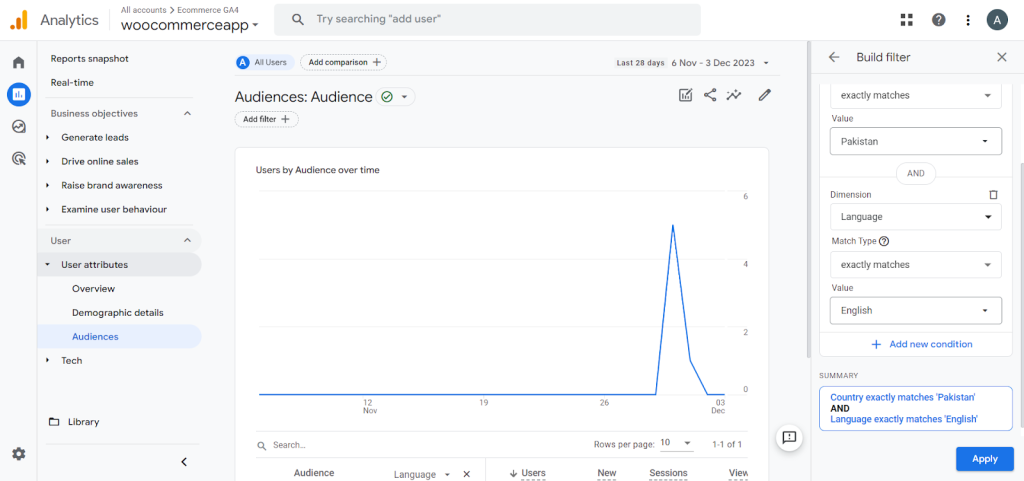
- This is how you can see your audience by groups.
Set Goals
Goal setting transforms aimless website analytics into highly focused tracking of business achievements. Google Analytics 4 empowers quickly defining key online store milestones as goals.
- To set goals on GA4, go to the Admin and navigate to the Conversions section.
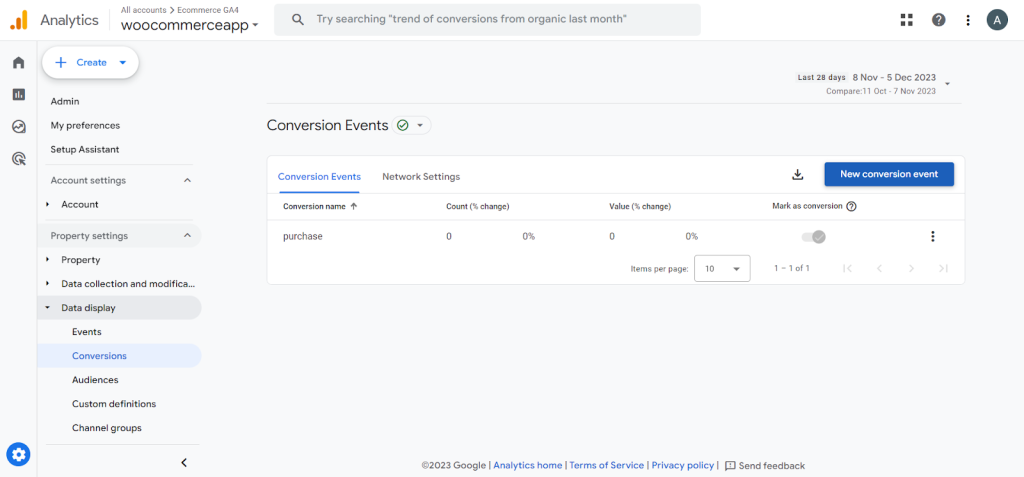
- Then, click on the “New conversion event” button and enter a name for the event.
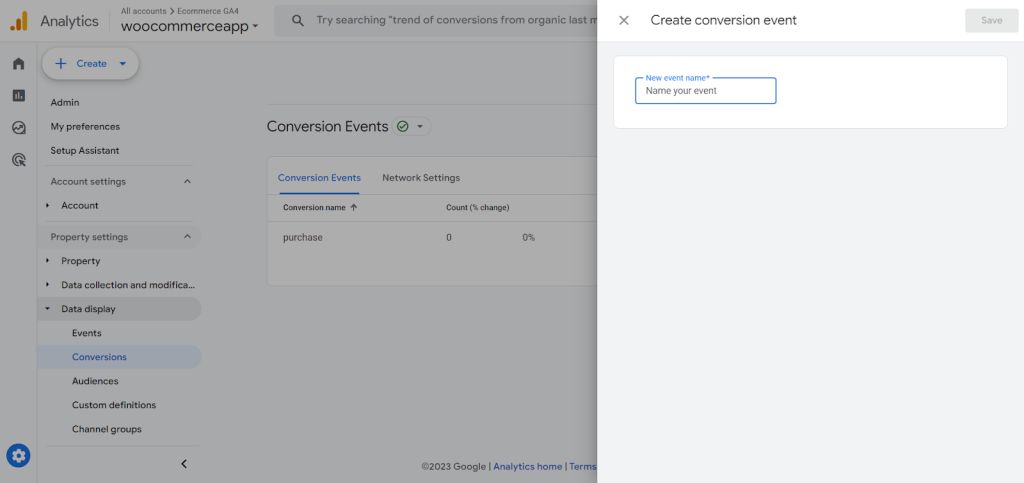
- Now, click on the “Save” button. You can see that you have successfully added a new goal.
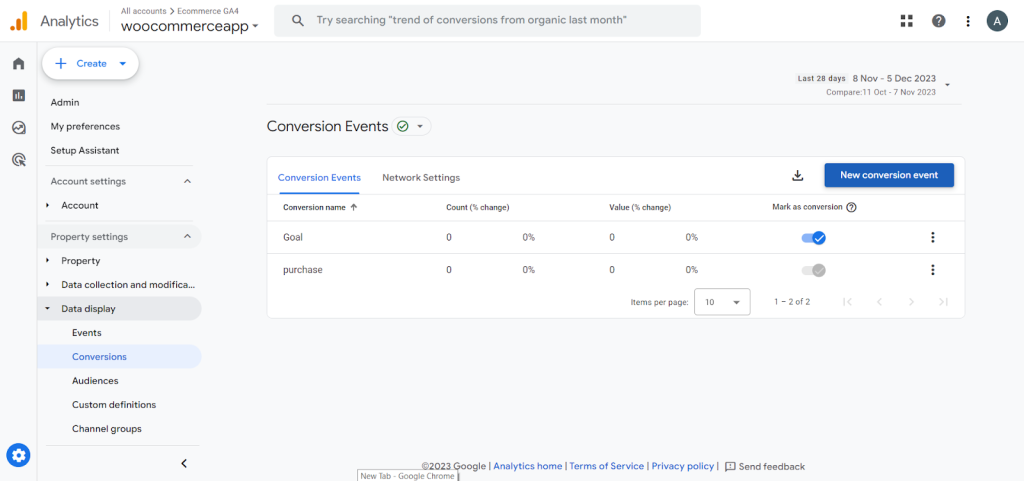
- Once done, click on the three dots in the right corner to edit and set values for the goal.
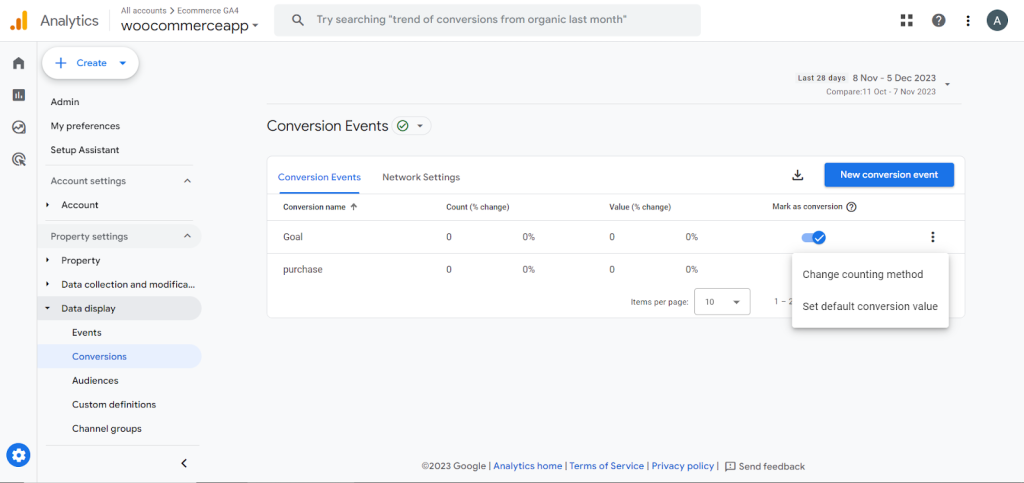
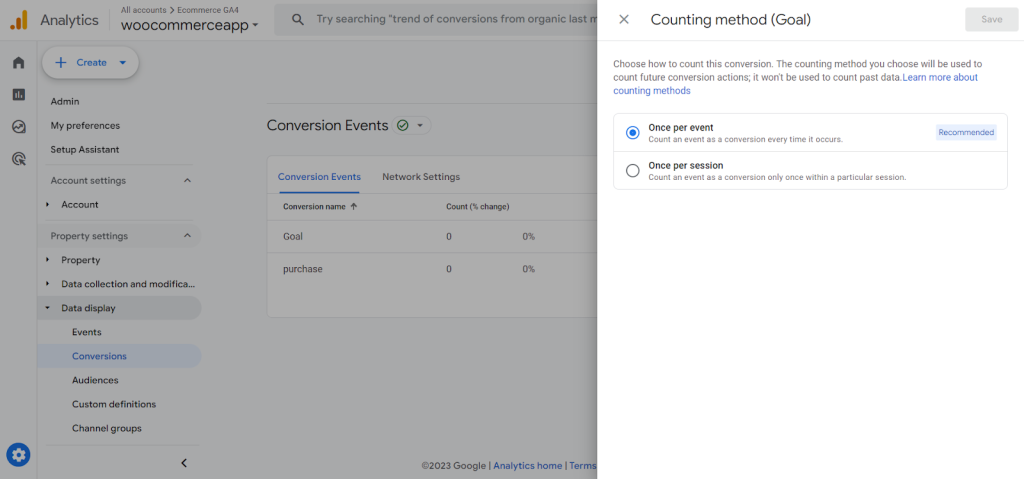
- Choose a counting method, either per event or per session.
- Set default conversion value by selecting currency type and rate.
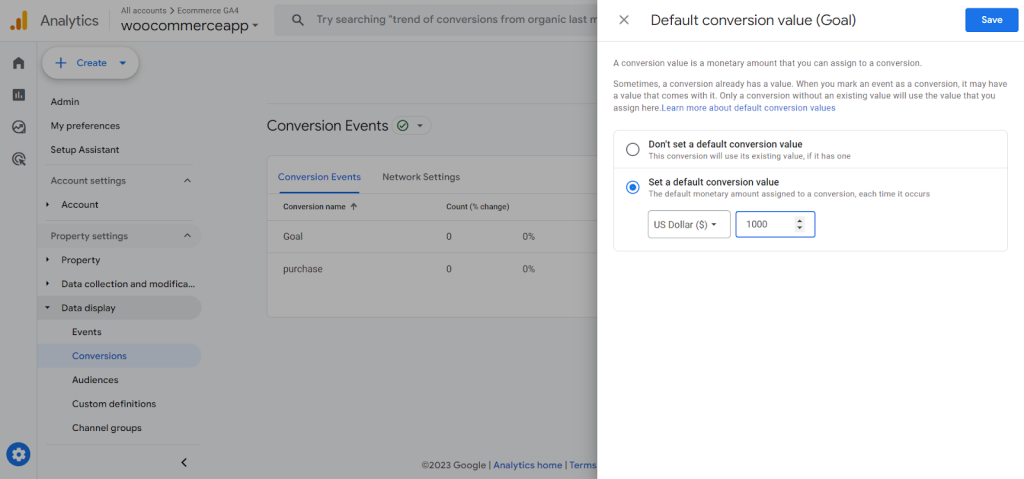
Remember to save the changes. We are done with adding a new goal. Goals help you quantify achievements like sales targets, lead generation, and conversions. Evaluating performance against goals shows what’s working.
Identify Keywords
Optimizing content for keywords driving significant website traffic is crucial for ecommerce success. Discover the top keywords driving traffic to your site so you can optimize your pages and content accordingly. Google Analytics provides visibility into keywords that are generating conversions. To find them,
- Go to the reports section on the left sidebar and navigate to Generate Leads >Landing Pages section. Scroll down to see the keywords.
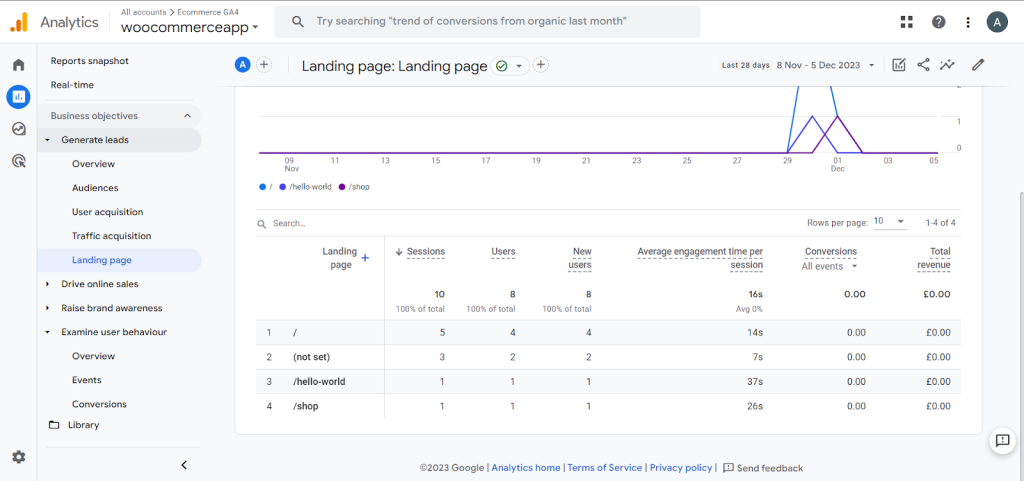
Review keywords ranking each landing page, Identify top pages by metrics like clicks and conversions, Filter keywords by performance potential, Volume, Competition, Commercial intent, Prioritize target keywords, Add selected phrases into content, Improve page relevance, and more.
Attract searchers who are actively hunting for relevant products through strategic optimization. GA4 spotlights high-impact opportunities to vault to the top of SERPs.
Optimize Bounce Rate
A high site-wide bounce rate signals dissatisfied visitors leaving pages quickly without engaging. Google Analytics arms ecommerce stores with diagnosing and treating the root causes.
Perform these tasks to bounce back in the game.
- Discover Worst Offenders: Pages ranked by highest exit rates reveal optimization targets.
- Diagnose the Issues: Slow loads? Confusing layouts? Weak calls-to-action? What detracts engagement?
- Outline Improvements: Personalize layouts? Strengthen incentives to stay?
- Implement Page-Specific Enhancements: Test treatment ideas lifting languishing pages.
- Track Effectiveness Over Time: Monitor bounce rate KPI to confirm progress or need for additional fixes.
Regain your visitors by analyzing and fixing the things causing bounce rates.
Insights for Maximum Success
Let’s have a look at the insights for maximum success.
Real-time Report
The Real-Time report shows current users on your site, traffic sources, locations on a map, and pages being viewed.
- Click on Real-Time in the left navigation menu on your GA dashboard to access it.
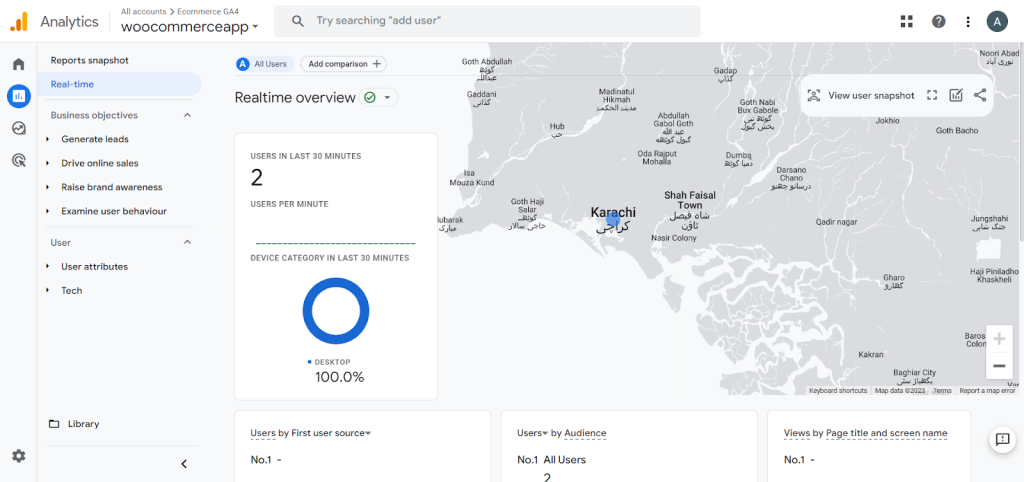
- You can view more real-time reports for Locations, Traffic Sources, Pages, Events, Conversions, etc.
- Google Analytics 4 has a “View user snapshot” tool to see an individual user’s activity and profile. The option is right above the Real-time reports; click and explore it.
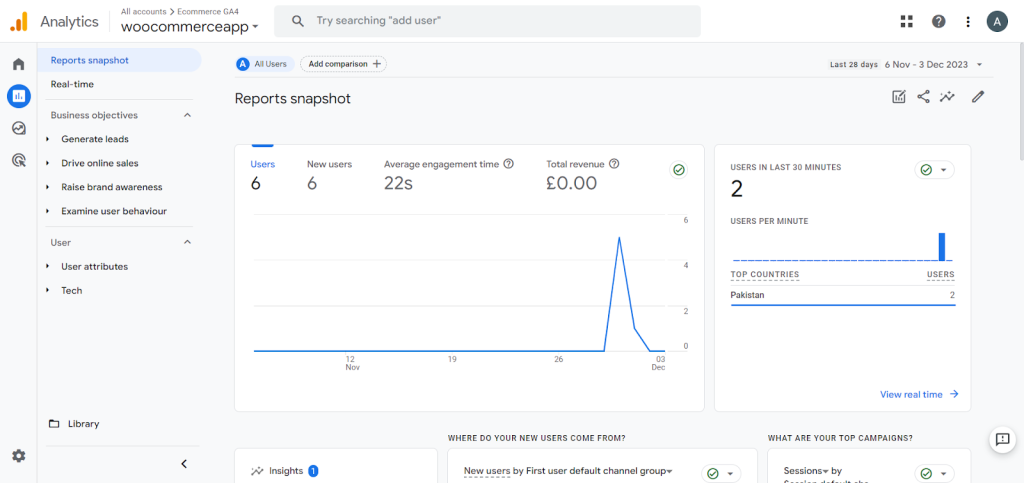
Real-time Reports have excellent use cases, monitor site traffic during a big sale event, and allow you to see the impact of email campaigns or influencer posts driving traffic to the site.
Purchase Report or Product Revenue
The Ecommerce Purchases report shows what visitors buy and the revenue generated. It provides data on products purchased, quantity, transactions, and revenue. If you run your store on Shopify, a handy Shopify sales tracker can surface these numbers instantly and work alongside GA4 for even deeper insight.
You can view the time to purchase from campaign exposure to the transaction. The overview shows total revenue, purchasers, first-time buyers, and purchases by product.
Access it in the Reports section and navigate to Drive online sales>Ecommerce purchases to explore everything.
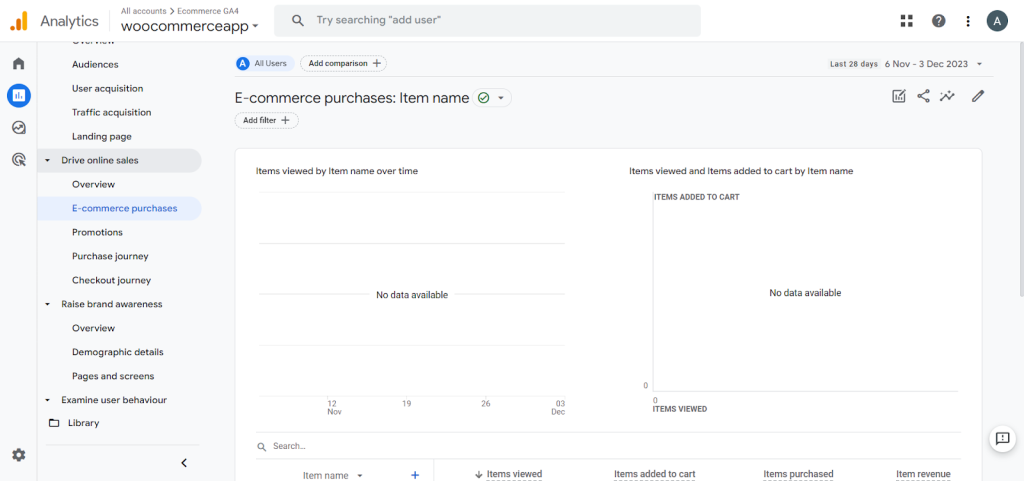
The report also provides metrics on item views, add-to-baskets, and basket-to-view.
Its use cases include identifying best-selling products for your customers, diagnosing issues with cart abandonment, and evaluating revenue per transaction and products per order.
The Item Revenue metric shows the total revenue from individual products over time. You can view the most prominent revenue contributors and underperforming items to inform promotions and updates.
Cart Abandonment Rate
Analytics can uncover when your ecommerce store visitors add products to their carts but do not checkout like a shopper browsing aisles without making a purchase. Here’s how you can leverage data to decrease cart abandonment:
Build a conversion funnel in Google Analytics that starts from Session Start through Purchase. The drop-off between Add to Cart and Purchase quantifies your website cart abandonment rate.
- Go to your GA dashboard and navigate to the “Explore” section on the left sidebar to do it.
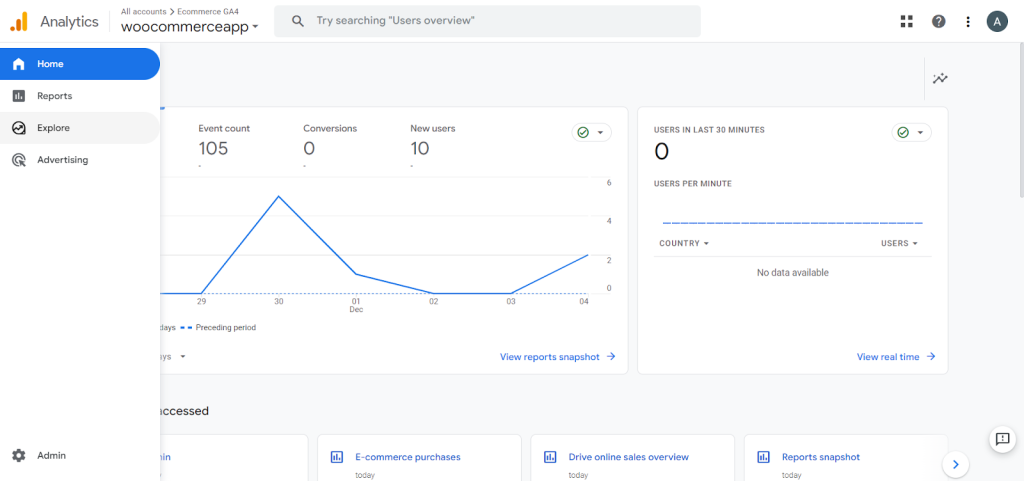
- Then, click on the “Funnel Exploration” tab.
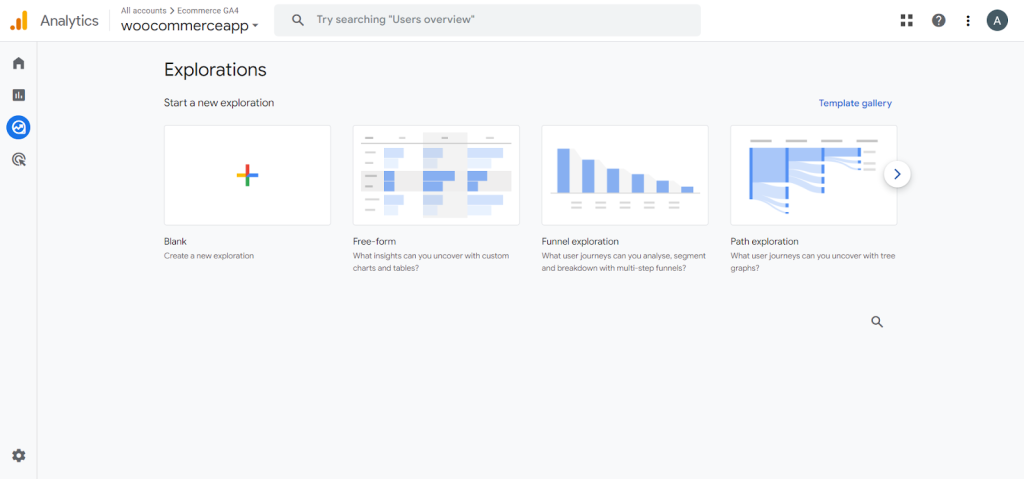
- Here, you can see the already existing funnels; click on the “+” sign to see all the funnels.
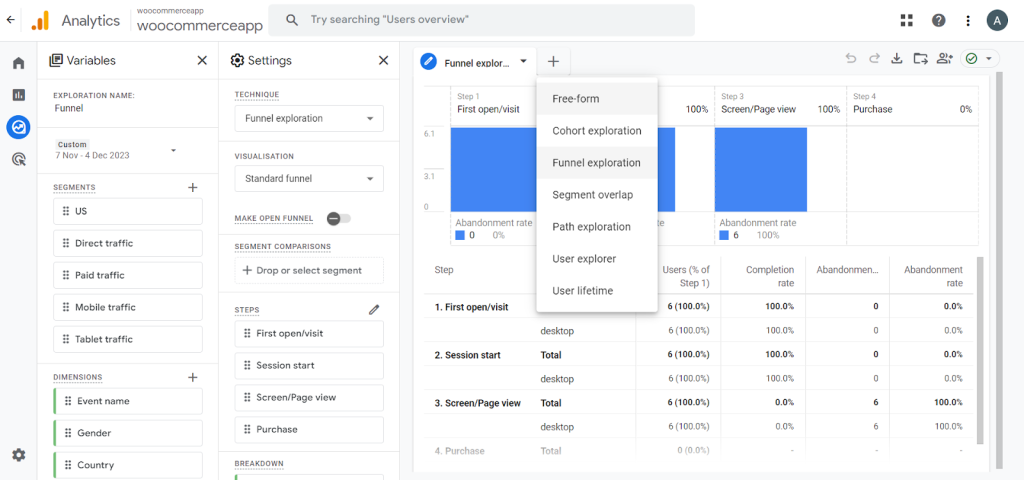
- You will see variables and settings panels on the left side, where you can customize things according to your choice. Click on the edit icon of the Steps section in the settings panel to customize them as you want.
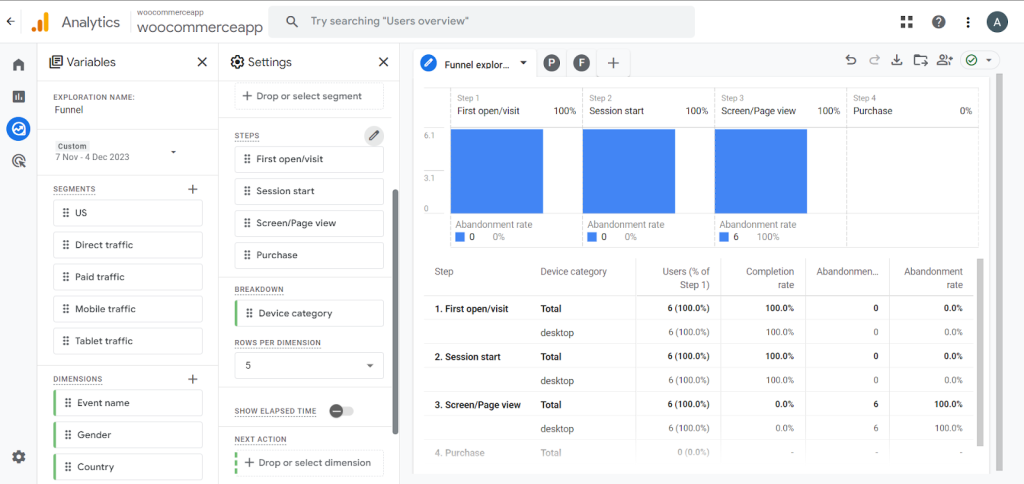
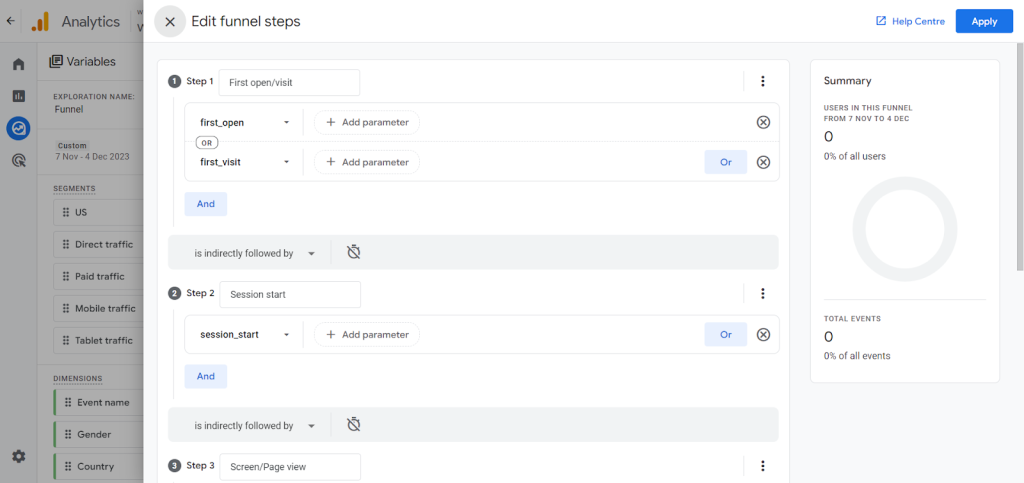
- Set it to start from the start session through the purchase. Once done with editing, click the “Apply” button on the right top.
Explore each session to customize it to get more advanced insights. You can create device-specific promotional campaigns motivating users to complete their orders and driving higher conversion rates.
GA empowers understanding of why potential buyers stepped out at the last minute. The data can detect checkout friction points, unreliable payment gateways, unclear policies causing uncertainty, etc. Turn insights into targeted solutions addressing the root causes behind abandonment.
Get strategic with cart remarketing across devices. Remind users of items left languishing in abandoned baskets through personalized messaging working across the customer journey. Meet them where they’re at to capture more sales. Cart abandonment data is your roadmap to the next level of conversion optimization in the world of ecommerce
Traffic Acquisition and Campaigns Data
Not all website traffic channels contribute equally when driving meaningful metrics like revenue and engagement. Google Analytics provides the data transparency to double down on channels that over-deliver with Traffic Acquisition.
- To see the traffic states, go to the Reports section on the left sidebar of your GA dashboard and navigate to Traffic Acquisition.
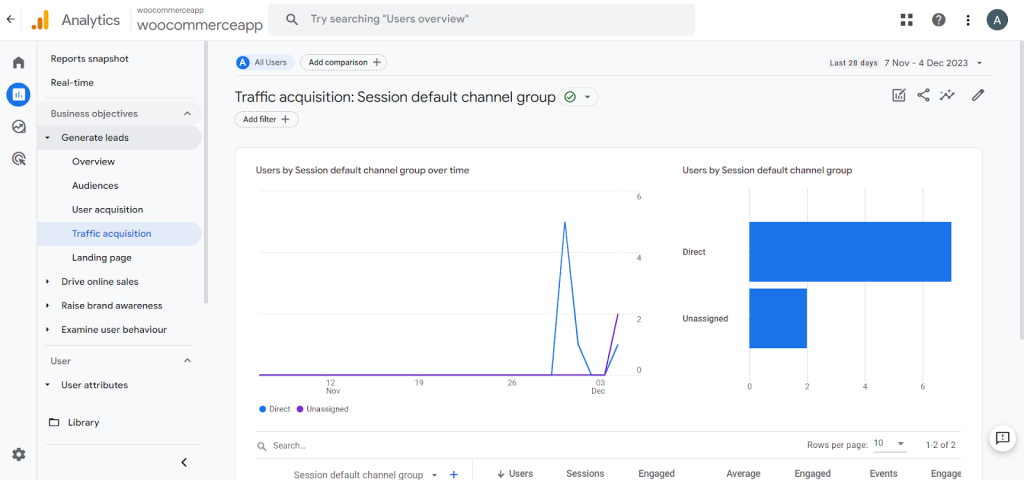
The visualization clearly shows channel performance across core KPIs, including Traffic Volume, Engagement Depth, Revenue Generation, and more.
Explore and learn the analytics strategic decision-making for future marketing campaigns and budget allocation. Optimize underperformers while increasing spending where the data proves ROI.
Displaying insights around acquisition sources gives you an analytical edge over the competition. Let metrics lead channel optimization and grow traffic, revenue, and engagement!
Landing Pages
Their initial interactions on your website profoundly shape a visitor’s journey. Google Analytics can diagnose whether landing pages are smooth or slow conversion to desired outcomes.
- To see the states of landing pages, go to the Reports section on the left sidebar of your GA dashboard and navigate to Landing Pages.
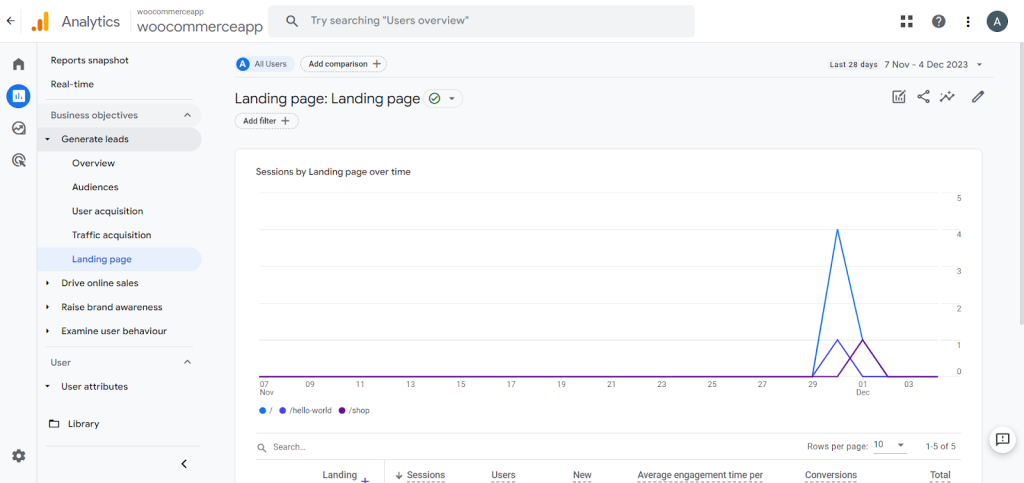
The Landing Pages report shows visitor behavior from the starting line, Traffic volume by entry page, Engagement and session length, Conversions achieved, Revenue obtained, and more.
These insights spotlight pages that delight versus daunt visitors, like confusing category layouts. Optimize page design, content, and calls to action to align with visitor intent.
It all comes down to first impressions – make them count. Let data guide landing page optimization to fast-track visitors into becoming customers. Welcome them on the journey ahead with compelling user experiences that turn interest into action.
Devices and Browsers
Visitors engaging with your website have one key attribute in common: their tech details. To see the states of devices, go to the reports section on your GA dashboard and navigate to the Tech Overview.
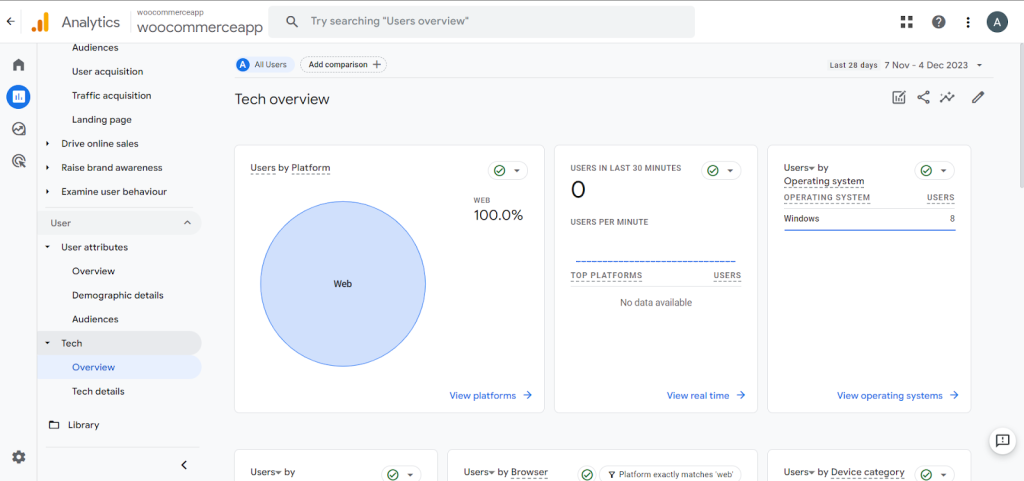
- To see the browser’s states, navigate to the Tech details.
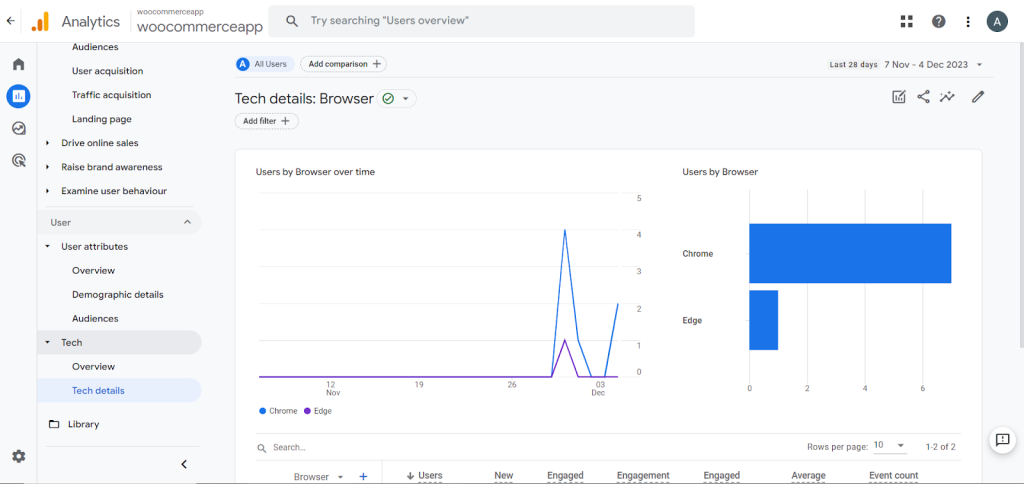
Google Analytics Technographics reports show performance insights across Device types, Browsers, Operating systems, Screen resolutions, and more.
You gain perspective on the customer journey with metrics segmented by these technical dimensions.
Device preferences for browsing vs buying, Browser conversion rates, Engagement by operating system, and Broken resolution layouts. These insights empower delivering optimized experiences for visitors. Identify top devices to guide mobile-first design. Detect poor-performing browsers to fix rendering issues.
Build a website masterfully adapted to ever-evolving consumer technology. Meet the needs of every device and browser at speed and scale through analysis guiding engineering. Convert interest into revenue with tech transparency as the blueprint.
Segments and Time Comparison
Not all website visitors share the same characteristics and behaviors. Powerful analytics explores performance differences across visitor segments defined by attributes like Demographics, Acquisition channel, Location, and Purchase history.
- Google Analytics reporting features comparison functionality to contrast metrics across segments. Accessible from any standard report, click “Add Comparison” and select the segment definitions for parallel analysis, such as New vs returning visitors, Paid search vs organic search users, Country/region, and Email list sign-ups vs general audience as we did above in the segments and filters section.
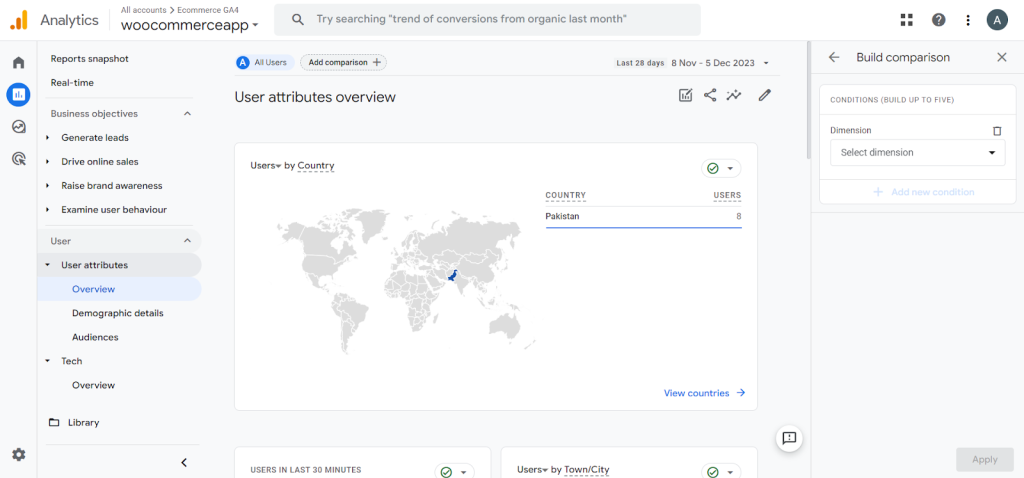
- Unlock insights like variability in engagement levels, product preferences, order values, and more. This intelligence guides personalization and customized experiences. Further layer time comparisons are needed to trace trends and progression over longer durations. Is the conversion rate improving quarter-over-quarter?
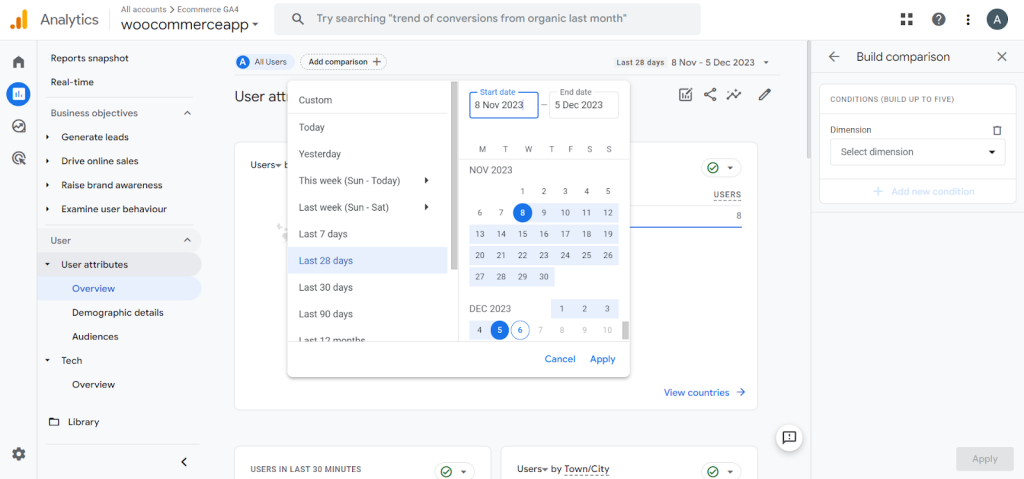
Derive action from customer analytics by assessing what happened and why and how outcomes diverge across visitor groups over time.
Conclusion
Data is the fuel for running business performance in an increasingly competitive digital marketplace. Ecommerce tracking in Google Analytics provides the keys to converting site traffic into transactional gains. By customizing each option through the configuration steps outlined above, previously invisible visitor behaviors transform into transparent, actionable insights. Store owners gain visibility into the entire shopping journey and leverage these intelligence gains to create personalized customer experiences.
Metrics-driven understanding guides strategies to attract high-value customers, build loyalty through relevance, and boost critical conversions powering revenue expansion. Testing and iterating using analytics reporting reduces hard work and risk. Google Analytics information richness creates possibilities previously out of reach. It’s time to stop driving ecommerce growth blind and graduate to an analytics-enabled future that converts interest into transactional outcomes.
